Biomedical Engineering Reference
In-Depth Information
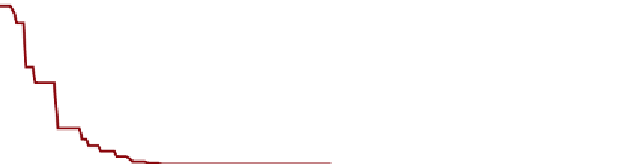
Figure 15. Evolution of the GA in the first 200 generations (5 internal iterations in the sigmoid ANN)
0 .0 4 5
0.6
0 .0 4
No time decreased activation
0 .0 3 5
0 .0 3
0 .0 2 5
0 .0 2
0 .0 1 5
0.01
0.3
0 .0 1
0.1
0 .0 0 5
0
1
1 1
2 1
3 1
4 1
5 1
6 1
7 1
8 1
9 1
1 0 1 1 1 1
1 2 1 1 3 1
1 4 1 1 5 1
1 6 1 1 7 1
1 8 1 1 9 1
2 0 1
Choosing
t = 30
, the equation becomes cha-
otic, and only short-term predictions are feasible.
Integrating the equation in the rank
[t, t + δ t]
we
obtain Equation 1.
With the same operation of the previous point
and with different values for the simulated time
decreased activation, in the Table 9 we can observe
the results for different combinations.
As we can see in Table 9 the hyperbolic activa-
tion function with 3 hidden neurons produces the
best value. In the following Figures we can see
the structure of this RANN and the comparative
of the predictions that it produces.
Table 5. Sunspots ANN parameters
Mean
Square
Error
Act. Funct.
Neurons
Hyperbolic
1
0.0069
Hyperbolic
2
0.0055
Hyperbolic
3
0.0039
Hyperbolic
4
0.0041
Hyperbolic
5
0.0040
Sigmoid
3
0.0047
Results for Mackey-Glass Time
Series
FUTURE TRENDS
The Mackey-Glass equation (Mackey-Glass,
1977) is an ordinary differential delay equation:
Now, when we have just reached the results showed
above, these investigations are going to continue
in the same way. We will try to develop an ANN
model as similar as possible to the natural neuron
function, especially, in the activation phase.
dx
ax
(
t
−
)
=
−
bx
(
t
)
c
dt
1
+
x
(
t
−
)


Search WWH ::

Custom Search