Database Reference
In-Depth Information
Only save the cluster assignment
We'll run the same command again for the
SimpleKMeans
and
Cobweb
clustering algo‐
rithms. We now have three files with cluster assignments. Let's create a t-SNE map‐
ping in order to visualize the cluster assignments:
$
< wine-both-scaled.csv csvcut -C quality,type | body tapkee --method t-sne |
>
header -r x,y > wine-both-xy.csv
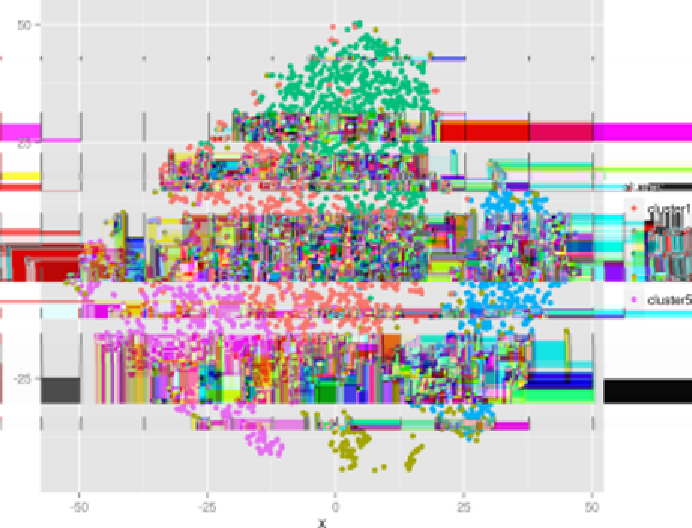
Next, the cluster assignments are combined with the t-SNE mapping using
paste
and
a scatter plot is created using
Rio-scatter
(see Figures
9-5
,
9-6
, and
9-7
):
$
parallel -j1
"paste -d, wine-both-xy.csv wine-both-cluster-{}.csv | "
\
>
"Rio-scatter x y cluster | display"
::: em simplekmeans cobweb
Figure 9-5. Clustering wines with the EM algorithm