Database Reference
In-Depth Information
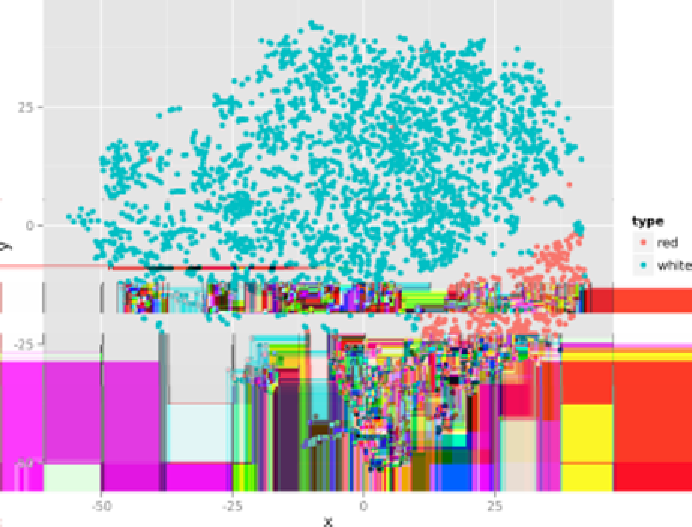
Figure 9-4. Non-linear dimensionality reduction with t-SNE
Note that there's not a single
classic
command-line tool (i.e., from the GNU coreutils
package) in these two one-liners. Now that's the power of creating your own tools!
Clustering with Weka
In this section, we'll be clustering our wine data set into groups. Like dimensionality
reduction, clustering is usually unsupervised. It can be used to gain an understanding
of how your data is structured. Once the data has been clustered, you can visualize
the result by coloring the data points according to their cluster assignment. For most
algorithms, you specify up front how many groups you want the data to be clustered
in; some algorithms are able to determine a suitable number of groups automatically.
For this task, we'll use Weka, which is being maintained by the Machine Learning
Group at the University of Waikato (Hall et al., 2009). If you already know Weka,
then you probably know it as a software with a graphical user interface. However, as
you'll see, Weka can also be used from the command line (albeit with some modifica‐
tions). Besides clustering, Weka can also do classification and regression, but we're
going to be using other tools for those machine-learning tasks.