Database Reference
In-Depth Information
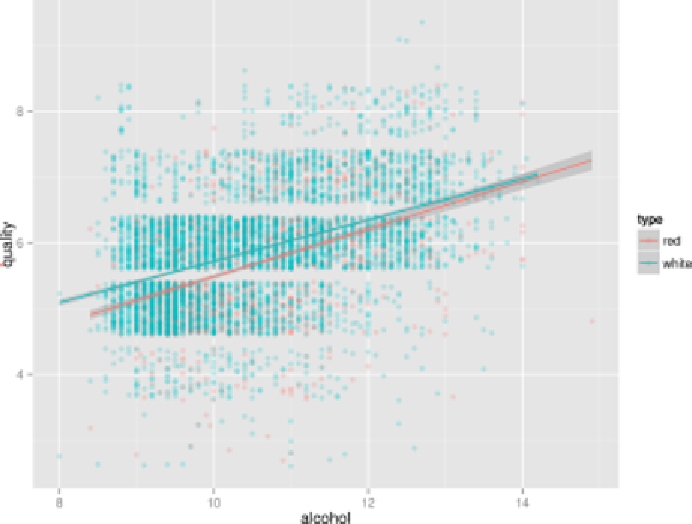
Does this mean that white wines are overall better than red wines, or that the white
wine experts more easily give higher scores than red wine experts? That's something
that the data doesn't tell us. Or is there perhaps a correlation between alcohol and
quality? Let's use
Rio
and
ggplot2
again to find out (
Figure 9-2
):
$
< wine-both-clean.csv Rio -ge
'ggplot(df, aes(x=alcohol, y=quality, '
\
>
'color=type)) + geom_point(position="jitter", alpha=0.2) + '
\
>
'geom_smooth(method="lm")'
| display
Figure 9-2. Correlation between the alcohol contents of wine and its quality
Eureka! Ahem, let's carry on with some modeling, shall we?
Dimensionality Reduction with Tapkee
The goal of dimensionality reduction is to map high-dimensional data points onto a
lower dimensional space. The challenge is to keep similar data points close together
on the lower-dimensional mapping. As we've seen in the previous section, our wine
data set contains 13 features. We'll stick with two dimensions because that's straight‐
forward to visualize.