Database Reference
In-Depth Information
$
csvstat wine-both-clean.csv --nulls
1. fixed_acidity: False
2. volatile_acidity: False
3. citric_acid: False
4. residual_sugar: False
5. chlorides: False
6. free_sulfur_dioxide: False
7. total_sulfur_dioxide: False
8. density: False
9. ph: False
10. sulphates: False
11. alcohol: False
12. quality: False
13. type: False
Excellent! Just out of curiosity, let's see what the distribution of quality looks like for
both red and white wines:
$
< wine-both-clean.csv Rio -ge
'g+geom_density(aes(quality, '
\
>
'fill=type), adjust=3, alpha=0.5)'
| display
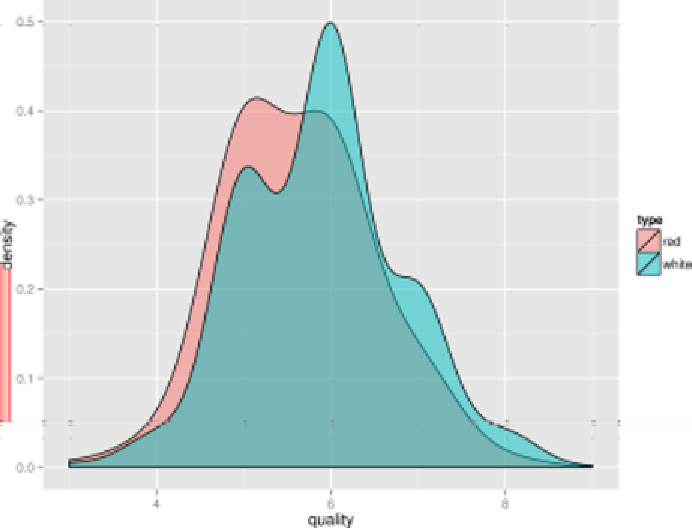
From the density plot shown in
Figure 9-1
, we can see the quality of white wine is
distributed more towards higher values.
Figure 9-1. Comparing the quality of red and white wines using a density plot