Database Reference
In-Depth Information
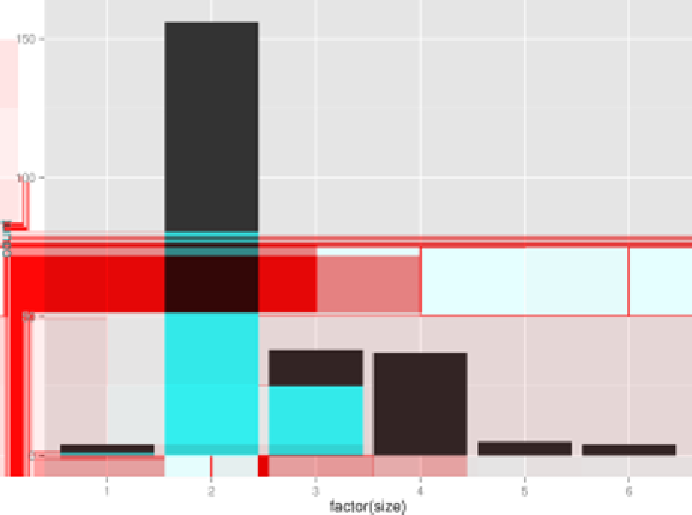
Figure 7-4. Bar plot
Using
feedgnuplot
:
$
< data/tips.csv | csvcut -c size | header -d | feedgnuplot --terminal
\
>
'dumb 80,25'
--histogram 0 --with boxes --unset grid --exit
160 ++--------+----***********----+---------+---------+---------+--------++
+ + * + * + + + + +
140 ++ * * ++
| * * |
| * * |
120 ++ * * ++
| * * |
100 ++ * * ++
| * * |
| * * |
80 ++ * * ++
| * * |
60 ++ * * ++
| * * |
| * * |
40 ++ * ********************* ++