Database Reference
In-Depth Information
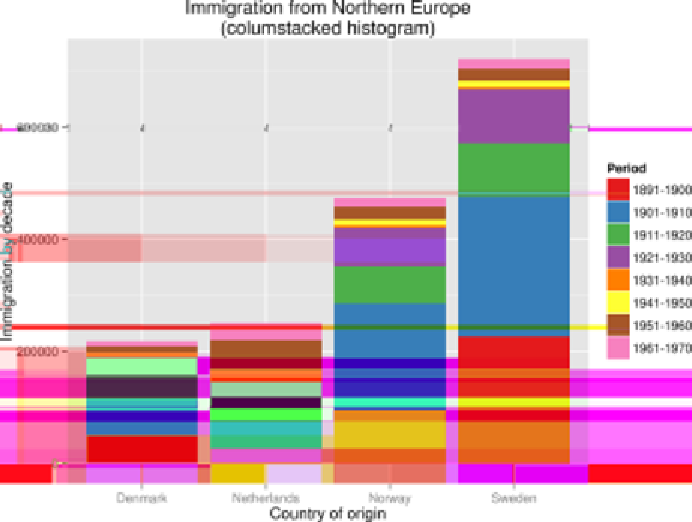
Now, we can use
Rio
again, but with an expression that builds up a
ggplot2
visualization:
$
< data/immigration-long.csv Rio -ge
'g + geom_bar(aes(Country, Count,'
\
>
' fill=Period), stat="identity") + scale_fill_brewer(palette="Set1") '
\
>
'+ labs(x="Country of origin", y="Immigration by decade", title='
\
>
'"Immigration from Northern Europe\n(columstacked histogram)")'
| display
The
-g
option specifies that
Rio
should load the
ggplot2
package. The output is an
image in PNG format (
Figure 7-2
). You can view the PNG image via
display
, which
is part of ImageMagick (ImageMagick Studio LLC, 2009) or you can redirect the out‐
put to a PNG file. If you're on a remote terminal then you probably won't be able to
see any graphics. A workaround for this is to launch a web server from a particular
directory:
$
python -m SimpleHTTPServer 8000
Figure 7-2. Immigration plot by Rio and ggplot2