Biomedical Engineering Reference
In-Depth Information
t
-test
p
-value are calculated to quantify the fit of the model.
A residual analysis calculates the standard deviation of the
error (
)) and defines a 95% confidence interval for the
estimated variable ([
1.96∗
;
1.96∗
). The
best regression models are obtained for the peak values for
the variables of the knee and hip, in particular the
flexion/extension moments and powers.
(
σ
ε
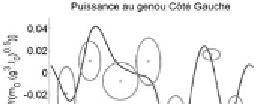
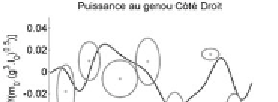
In order to illustrate the potential of these regressions,
the kinematic and dynamic variables for a 7 year old child
suffering from right hemiplegia have been computed, from
the measurements taken while he was walking at a
dimensionless speed of 0.39. We then used the regression
parameters of the model established for a healthy reference
population to estimate the kinematic and dynamic variables
of a healthy child of the same age walking at the same speed.
This model defines “target zones” for each kinematic or
dynamic variable, which can be plotted on the curves of the
temporal evolution of gait variables for the subject. For
example, the results for power at the knee are shown in
Figure 5.5.
Power at knee (left side)
Power at knee (right hemiplegic side)
% gait cycle
% gait cycle
Percentage of gait cycle
Percentage of gait cycle
Figure 5.5.
Curves of the temporal evolution of power
at the knee in the unhealthy subject (dark gray curve) and
targets representing the healthy subject (light gray ellipses)
Overall, the values of the peaks of the curves are higher
than the reference for the left lower limb and lower for the