Environmental Engineering Reference
In-Depth Information
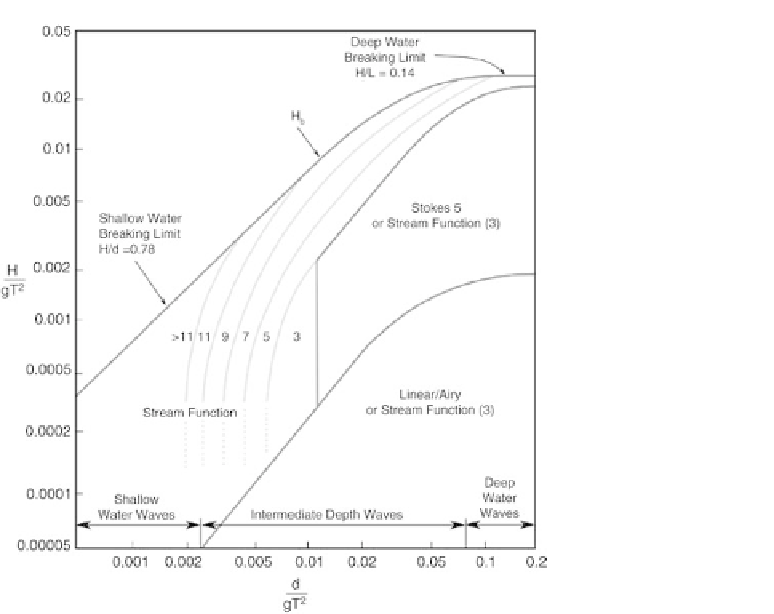
Fig. 2.23 Wave theory selection diagram ([11] 4.G.1)
To conclude this section it should be mentioned that a transition from the deterministic to a
statistical concept is not readily possible for waves of finite steepness because the
superposition principle does not apply to non-linear wave theories. Figure 2.23 illustrates
the validity ranges of the numerical wave theories.
2.5.5 Statistical description of the sea state
A three-part approach is mostly used for describing the sea state [20]:
1. The displacement of the surface of the water at a location is measured over time
and classified into solitary waves with an associated period (T
i
) and height (H
i
)
using methods such as the zero-crossing method, for instance (stage 1 - time
series).
2. To reduce the amount of data, all the waves of one set of measurements are analysed
statistically and reduced to significant parameters or spectral functions (e.g.
Pierson-Moskowitz or JONSWAP spectrums) (stage 2 - short-term statistics).
3. If we consider the variability of the sea state parameters over longer periods of time,
then we arrive at the sea state climate (stage 3 - long-term statistics), which is
mostly presented in the form of a scatter diagram or distribution functions.

