Environmental Engineering Reference
In-Depth Information
the loading frequencies of laboratory tests and those of real structures. The fatigue
strengths determined experimentally in laboratory tests lead to larger values than the
fatigue strengths of actual structures because of the higher loading frequency. In
addition, as the strength increases, so the increasingly brittle failure behaviour of the
concrete is taken into account by the factor (1
f
ck
/250) in Equation 4.5.
As for the short-term strength according to [33], the partial safety factor is taken as
g
c
¼
1.50 (or according to [11], see also Section 4.6.5, Table 4.8).
As the actions are taken into account by employing collective loads that already include
the maximum values of the actions, the partial safety factor for the actions according to
Model Code 90 [66] is
g
f,fat
¼
1.00.
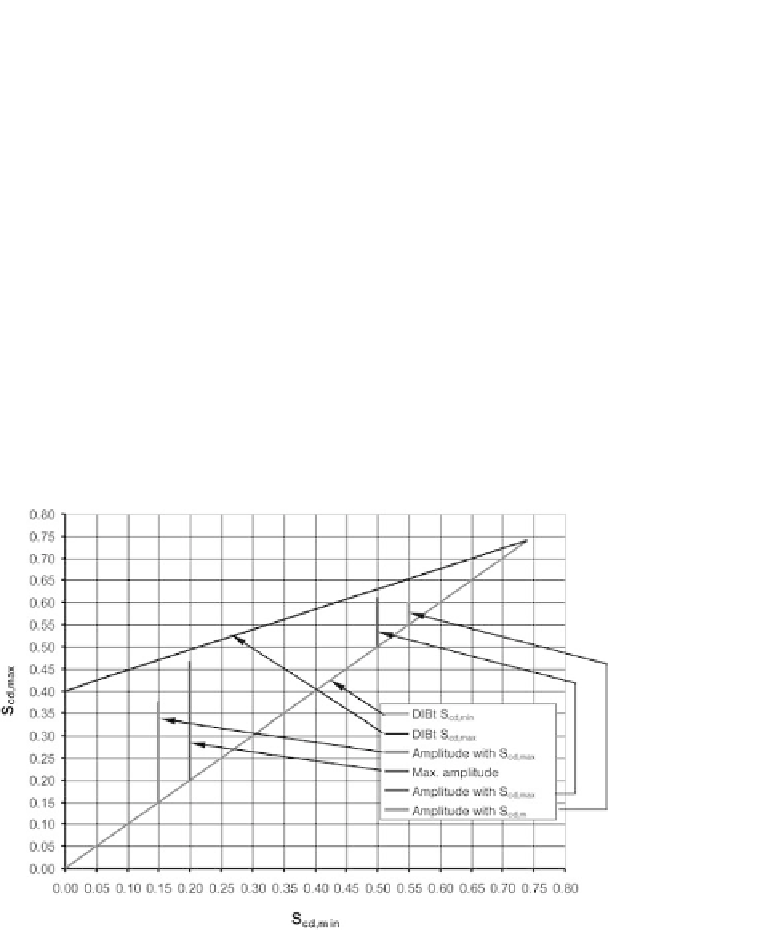
The following must always be investigated in a simplified analysis (Figure 4.29):
- stress range
D
S
cd
with S
cd,min
- maximum stress range max
D
S
cd
- stress range
D
S
cd
with S
cd,max
- stress range
D
S
cd
with S
cd,m
Fig. 4.29 Goodman diagram for concrete subjected to a repeated compressive load
4.9.2.2 Direct analysis according to DIBt guideline
If the conditions for the simplified analysis are not satisfied, the fatigue analysis can be
carried out on the basis of the total loading spectrum according to Model Code 90 [66].
The fatigue analysis is based on a model for calculating damage according to Palmgren
and Miner [49]. As already outlined in Section 4.9.1.1, the basic idea here is that every
cyclic action effect causes damage in the structural component and that this damage
accumulates linearly until a critical level is reached. At that point it is presumed that the

