Biology Reference
In-Depth Information
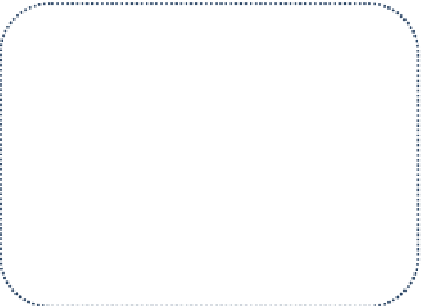
HUMAN HOST
Immune
effects
Immune
effects
Population of
mature
worms, M
Mortality,
µ
Infection,
(t)
Behavioural
effects
Density
dependence
Density
dependence
Density
dependence
Production of
eggs
Density
dependence
Environmental
effects
Environmental
effects
Population of
infective
stages, L
Mortality,
µ
1
FIGURE 9.3
Schematic flow diagram of the populations of worms and eggs in the life-
cycle of Ascaris.
10
the probability that a contact results in parasite establishment, N is human
population density, d
1
is the proportion of infective stages that gain entry
to the host that survives to reach sexual maturity to contribute to fecun-
dity, d
2
is the fraction of eggs excreted from the infected host that survive
to become infective stages,
m
is the human death rate (1/
m ¼
life expec-
tancy),
m
1
is adult worm death rate in the host, and
m
2
is the death rate of
infective stages in the external environment.
16
Inspection of Eq.
(9.2)
shows that the numerator represents fecundity and transmission success
while the denominator denotes losses due to death in various stages in the
life-cycle. Or, put another way, the expression for R
0
is simply fecundity
and transmission success times life expectancy of the various stages in the
life-cycle. Thus, different soil-transmitted helminths (STH) achieve R
0
>
1
by different balances of longer life expectancy and low infectiousness or
shorter life expectancy and increased infectiousness. In reality, this
representation for R
0
is too simple in the face of known biological
complexity. However, it is fairly straightforward to add density depen-
dence in processes such as fecundity and survival, mating probabilities,
seasonality in transmission, acquired immunity and host age and sex
structure.
10,14
None of these really add much to the insights gained from
the simple version denoted in Eq.
(9.2)
.