Biology Reference
In-Depth Information
0.1
0.2
0.5
1.0
2.0
5.0
10.0
20.0
50.0
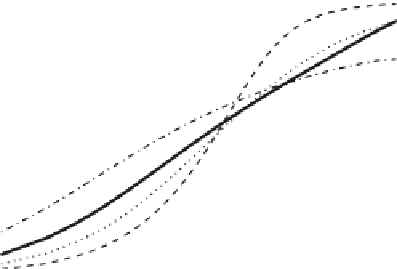
Mean worm burden
FIGURE 7.5
The predicted relationship between the diagnostic sensitivity of an
ether-sedimentation technique
48
and average community worm burden.
Predictions were
derived using the fitted relationship between the probability of observing a zero egg count,
p
, and female worm burden, x, depicted in
Figure 7.4
(B) and making the assumptions that:
there is an equal (1:1) sex ratio of males and females, and the distribution of males
and females is well described by a negative binomial distribution with mean m. The over-
dispersion parameter was varied: k
/N
(Poisson distribution), thin dashed line; k
¼
1, thin
dotted line; k
¼
0.1, thin dot-dash line; k is a parameterized linear function of m from Guyatt
et al.,
57
thick solid line.
a constant variance (homoskedasticity) are rarely appropriate. One solu-
tion is to transform the data so that they conform better to these
assumptions,
136
although the often used logarithmic transformation is not
recommended.
137
Rather, Anscombe
138
derived an inverse-hyperbolic
sine for transforming negative binomial data (optimized trans-
formations for the Poisson and binomial distributions are also given in
Anscombe's paper).
The development of generalized linear modeling methods by
Nelder and Wedderburn in 1972
139
permitted efficient regression analysis
of non-normally distributed data that fell within the exponential family of
distributions, a family that includes, among others, the Poisson, binomial
and the negative binomial with known dispersion parameter k.
140,141
The
generalized linear model framework has also been extended to permit
simultaneous estimation of k and other regression parameters (covariate