Biology Reference
In-Depth Information
*
*
**
*
*
0
10
20
30
40
50
60
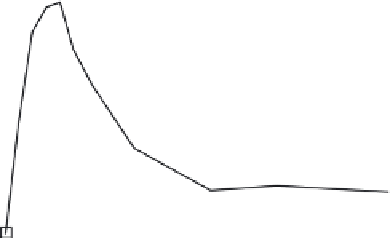
Mean age of age group (years)
FIGURE 7.2
Baseline age-intensity profile of
Ascaris lumbricoides
in a community in
Bangladesh, stratified by host sex.
104
Data points are arithmetic mean worm burdens from
individuals in the age groups: 1
e
3; 4
e
5; 6
e
7; 8
e
9; 10
e
11; 12
e
13; 14
e
17; 18
e
27; 28
e
37;
38
years. Squares and circles represent means for males and females, respectively.
Stars indicate statistically significant differences between the sexes as indicated by a two-
sample t-test. * p-value
e
47; 48
þ
<
0.05; ** p-value
<
0.01.
rapidly.
102
There is no parasitological evidence for a peak shift in
A. lumbricoides, although a recent study has identified a peak shift in IgE
concentrations, possibly indirect evidence for protective immunity.
103
However, variability in age-intensity profiles between the sexes, partic-
ularly in adults, has been anecdotally related to different cultural and
occupational practices of men and women
104
and boys and girls
75
=
FIGURE 7.1
Distributions of
Ascaris lumbricoides
egg counts (eggs per gram of feces)
from three communities in: (1) Bangladesh,
98
(2) India
19
and (3) Nigeria.
59
The dotted and
solid lines represent the fitted negative binomial (NB) and zero-inflated negative binomial
(ZINB) distributions. In each case the ZINB distribution is a statistically better fit to the data.
The maximum likelihood estimates of the mean, m, overdispersion parameter, k, and
e
for
the ZINB distribution
e
the probability of a zero arising from the Bernoulli component,
p
,to
2 significant figures are as follows: (A) NB, m
¼
1900, k
¼
0.23; ZINB, m
¼
2500, k
¼
0.77,
p ¼
0.22;
(B) NB, m
¼
11,000, k
¼
0.32; ZINB, m
¼
12,000, k
¼
0.88,
p ¼
0.13;
(C) NB,
m
0.13. Note that the x-axis is truncated at
the 90th percentile of the corresponding egg counts.
¼
14,000, k
¼
0.32; ZINB, m
¼
16,000, k
¼
0.85,
p ¼