Image Processing Reference
In-Depth Information
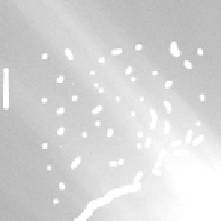
Figure 9.7
Output after 35 iterations of training using MAE/MSE hybrid measure.
Table 9.1.
This table shows the improvement in the two quality measures after 35 and 500 it-
erations of the GA applied to the training set. The absolute values of the two measures are
not directly comparable because the SSIM is much more closely related to the way in which
the image is perceived by the human visual system. It can be seen, however, that SSIM
makes a much greater improvement and continues to improve significantly between 35 and
500 iterations. On the other hand, the measure based on the mean-absolute and
mean-square error makes very little further improvement after 35 iterations.
Original image
After 35 iterations
After 500 iterations
MAE/MSE
0.9844
0.9957
0.9960
SSIM
0.7468
0.9242
0.9910
the image is perceived by the human visual system. However, it can be seen that
SSIM makes a much greater improvement and continues to increase significantly
between 35 and 500 iterations. Conversely, the measure based on the mean-abso-
lute and mean-square error makes very little further improvement after 35 itera-
tions.
The filter parameters resulting from the GAs after 500 iterations are shown in
Figs. 9.11 and 9.12. As can be seen, these two filters have very different parameter
values.


