Information Technology Reference
In-Depth Information
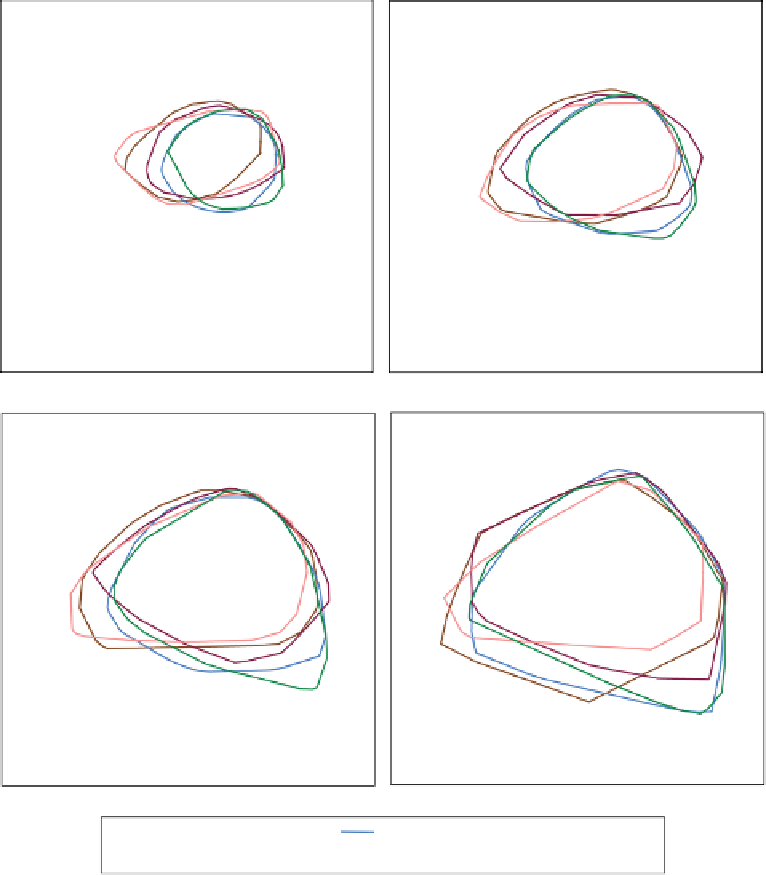
50% bags
75% bags
90% bags
99% bags
31 to 40 yrs
41 to 50 yrs
51 to 60 yrs
Older than 60
Younger than 30 yrs
Figure 2.42
Biplots with selected
α
-bags of the mail order catalogue data set. The
α
-bags demarcate the deepest 100
α
% of the respondents in the different age groups.
equip the Figure 2.28 biplot with user-specified
α
-bags. Figure 2.42 shows this with
0.50-, 0.75-, 0.90- and 0.99-bags. Plotting of individual sample points as well as the axes
has been suppressed but the user can interactively add sample points, means, or axes
as required.
A detailed discussion with illustrations of the capabilities of
PCAbipl
and related
biplot functions contained in
UBbipl
is given in Chapter 3 where a closer look is taken
at PCA biplots.


