Information Technology Reference
In-Depth Information
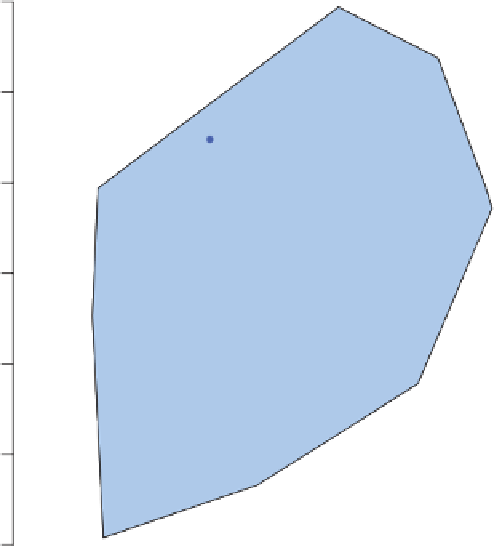
side, the convex hull will be unchanged as long as the sample points on the perimeter
remain the same. It is clear from Figure 2.35 that convex hull peeling could remove
the influence of extreme data points, but the process is rather inflexible without utilizing
fully the statistical properties of the data set.
In univariate data, the boxplot is a useful tool for summarizing the location, spread,
skewness and outliers in data. Several suggestions have been made for generalizing this
concept to bivariate data (see, for example, Goldberg and Iglewicz, 1992; Zani
et al
.,
1998; Liu
et al
., 1999). Another such bivariate generalization by Rousseeuw
et al
. (1999),
for which they coin the term
bagplot
, incorporates all the properties of the univariate
boxplot.
A bag is constructed containing 50% of the data points. A fence is constructed by
inflating the bag by a (default) factor of 3. Observations outside the fence are flagged
as outliers. The whiskers can be represented in several forms: lines from the bag to the
observations outside the bag but inside the fence; star-shaped whiskers connecting the
observations outside the bag but inside the fence in such a way that it never cuts off a
45
50
55
60
65
70
75
LGAN
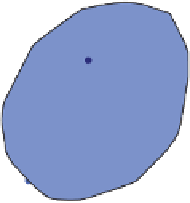
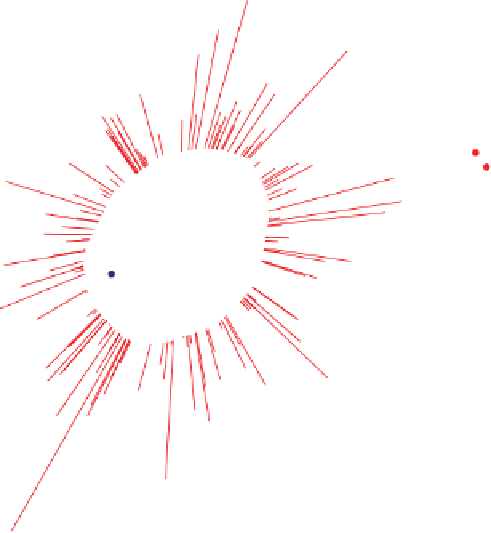
Figure 2.36
Bagplot of the two head dimension variables. The dark blue area is the
bag. The fence, which is not shown, is formed by inflating the bag by a factor of 3.
The loop is shown as the convex hull of the sample points inside the fence. Whiskers
are denoted by the red lines. The two samples outside the fence can be considered as
outliers.