Information Technology Reference
In-Depth Information
Q90
Q79
Q78
Q58
Q85
Q71
Q87
Q77
Q80
Q81
Q68
Q82
Q84
Q73
Q66
Q69
Q64
Q75
Q49
Q60
Q72
Q70
Q62
Q57
Q86
Q83
Q89
Q76
Q88
Q67
Q65
Q74
Q61
Q59
Q63
Q41
Q40
6
6
Q35
2
5
3
6
7
20 to 30 yrs; n = 341
31 to 40 yrs ; n = 341
41 to 50 yrs; n = 246
51 to 60 yrs; n = 146
Older than 60 yrs; n = 57
5
7
6
Q47
5
5
7
7
8
7
5
7
7
7
6
5
7
6
7
6
6
Q36
8
6
8
5
6
6
8
Q55
5
3
4
4
6
Q52
5
Q53
Q44
6
5
6
7
7
Q51
Q48
4
6
6
6
6
5
6
6
4
8
Q56
5
Q45
7
5
Q54
4
4
7
5
4
5
6
7
7
4
5
5
Q50
6
4
5
7
6
Q43
7
6
4
5
Q46
4
5
7
7
Q42
5
6
5
5
5
4
6
7
Q34
5
5
Q37
5
3
6
4
5
5
Q38
6
4
4
3
6
5
6
5
6
7
5
6
4
2
3
4
6
4
4
5
6
6
5
5
4
5
3
4
3
6
4
5
Q33
3
3
Q39
6
3
4
3
4
5
4
4
4
5
4
6
3
3
4
4
2
4
5
Q11
6
5
4
4
4
5
5
4
3
5
4
5
4
4
3
Q23
7
6
Q15
5
Q28
7
7
5
3
4
7
Q4
Q13
Q22
Q27
5
Q17
Q6
6
Q26
8
6
3
7
7
6
6
5
5
3
2
6
6
3
3
3
Q24
6
5
4
Q12
Q29
Q31
Q9
3
4
6
Q3
Q20
6
6
6
6
7
3
5
4
3
3
7
5
6
6
5
3
4
8
5
5
5
3
4
Q7
4
3
Q19
Q25
Q2
5
5
5
5
6
5
3
4
7
4
6
5
3
3
2
3
4
Q8
8
6
4
5
5
4
2
4
3
3
3
Q32
5
4
4
4
2
3
4
3
3
Q14
6
7
6
5
4
4
4
5
7
5
4
4
4
4
4
5
3
3
Q30
5
4
3
3
Q18
6
6
3
3
3
5
4
4
4
3
4
4
4
4
3
3
2
3
2
4
Q16
6
5
4
5
3
3
4
3
5
5
4
3
3
3
3
3
3
3
2
2
2
Q5
4
4
3
4
4
3
2
3
2
Q1
3
3
3
2
3
2
3
2
2
2
3
2
2
3
2
2
2
2
2
2
3
2
2
3
2
2
1
1
4
2
2
2
2
1
2
1
1
0
2
3
2
2
2
1
1
0
Q10
2
2
2
2
1
2
2
1
1
1
1
0
0
3
1
1
1
1
1
1
1
2
2
1
1
0
Q21
2
1
1
0
0
2
1
1
1
1
1
0
0
0
6
5
4
3
3
2
1
0
0
0
5
4
2
3
3
1
1
1
0
0
7
6
2
2
3
2
2
0
0
3
2
0
2
4
1
0
5
3
2
2
0
0
0
3
2
0
2
2
2
0
2
2
2
3
2
4
2
0
2
2
3
2
2
2
0
1
2
4
1
2
1
1
1
2
1
2
1
1
1
2
2
1
1
2
3
1
1
3
1
1
1
1
1
1
1
1
1
1
2
1
1
1
4
1
1
1
1
1
1
3
1
1
1
2
1
1
1
0
1
2
1
1
0
0
0
1
1
1
1
3
1
0
0
0
1
3
0
0
0
1
0
2
1
0
0
0
0
0
0
0
0
0
0
0
0
3
0
0
1
0
0
0
0
0
0
0
1
0
1
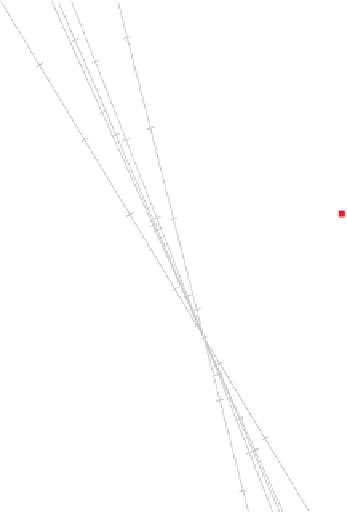
Figure 2.28
PCA biplot of 1135 respondents' answers to 90 questions addressing rea-
sons, risks and risk relievers when buying from mail order catalogues. Respondents are
colour-coded according to their age categories.
2.9 Enclosing a configuration of sample points
Flury (1988) described data giving head dimensions consisting of the following six
variables measured for 200 young men and 59 young women:
MFB
(minimal frontal
breadth),
BAM
(breadth of angulus mandibulae),
TFH
(true facial height),
LGAN
(length from glabella to apex nasi),
LTN
(length from tragion to nasion) and
LTG
(length from tragion to gnathion). These data are available in the R package
Flury
in
the dataframes
swiss.heads
(the 200 males) and
f.swiss.heads
(the 59 females). We
combined both these dataframes into the dataframe
Headdimensions.data
in
UBbipl
.
Figure 2.31 is a scatterplot of the head dimensions data for variables
LGAN
and
LTN
resulting from the R instruction
> plot(Headdimensions.data[,c(5,6)], pch = 16, asp = 1)
Of course, Figure 2.31 is also a biplot.
We turn our attention now to several devices proposed for enclosing predefined sets
of observations with the aim of finding a representative graphical summary of the shape
of bivariate sample points belonging to a particular configuration.


