Information Technology Reference
In-Depth Information
i
i
u
u
e
e
o
o
a
a
i
i
e
u
u
e
o
o
a
a
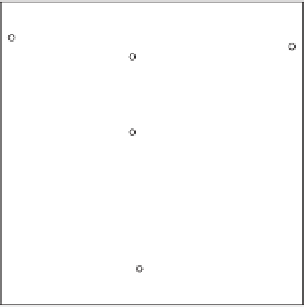
Figure 10.11
(Top left) Two-dimensional hedron plot of the vowels in the Rothkopf
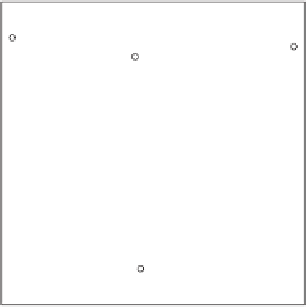
Morse code data. (Top right) Hedron plot with area O
au
(O denoting the origin indi-
cated by the grey cross) approximating
n
15
=
11
.
5 and area O
ai
approximating
n
13
=−
9.
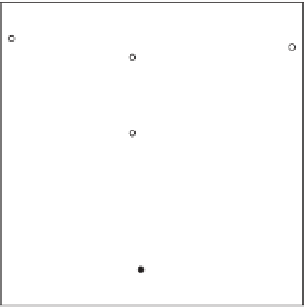
(Bottom left) Hedron plot with area O
ei
approximating
n
23
=
3
.
5andareaO
oi
approxi-
mating
n
43
=−
2
.
5. (Bottom right) Hedron plot with area O
oa
approximating
n
41
=
0
.
5
and area O
uo
approximating
n
43
=−
2
.
5.
10.4 Area biplots
The area representation of asymmetry can also be used with genuine biplots. For example,
with biadditive models
X
AB
we plot
A
for rows and
B
for columns (see Chapter 6)
and we have seen how the inner product can be recovered by plotting different symbols
for the points. The evaluation of the inner product visually has the difficulties discussed
in Section 2.3. As an alternative, we may treat either the rows or the columns as if
they were variables and choose one of them to be represented by calibrated axes. This
can work quite well but is an asymmetric representation of what is a symmetric data
structure - symmetric in the sense that rows and columns are interchangeable, not that
X
is a symmetric matrix.
In two dimensions
A
and
B
will each have two columns. If R
i
=
is the
i
th row
point and C
j
;
see Figure 10.12 for notation. By rotating C
j
through 90 degrees to C
j
,wehavethat
the
j
th column point, the estimate of the inner product is
r
i
c
j
cos
(θ
ij
)