Information Technology Reference
In-Depth Information
BMCFD (0.98)
1
0.8
0.6
0.4
RMOF (0.96)
EXFFBB (0.95)
1
1
0.8
0.2
0.8
0.6
0.6
0.4
0.4
0.2
0.4
0.2
0.6
0.2
0.8
1
0.2
0.4
BMCFF (0.97)
0.6
0.2
0.8
1
0.4
RMP (0.87)
0.6
0.8
1
BMSWA (0.82)
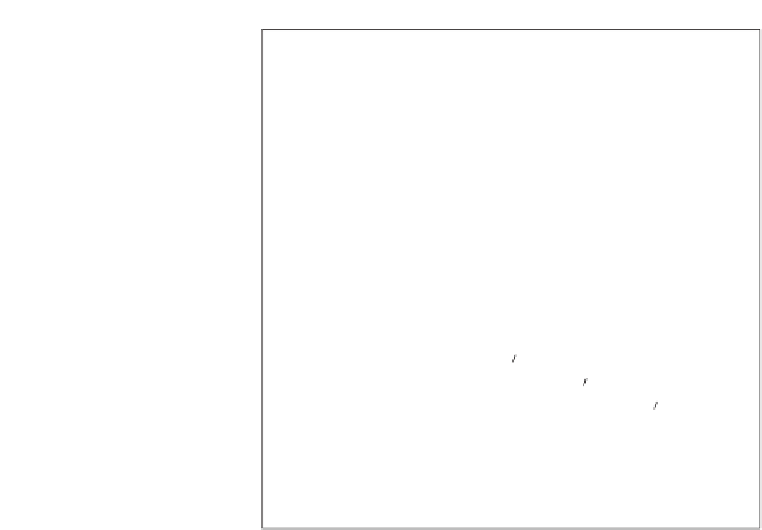
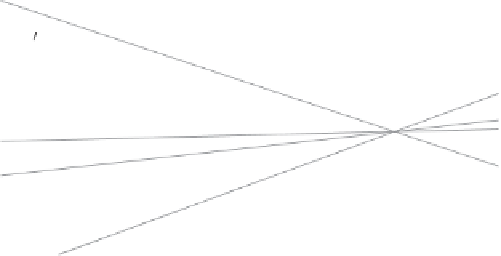
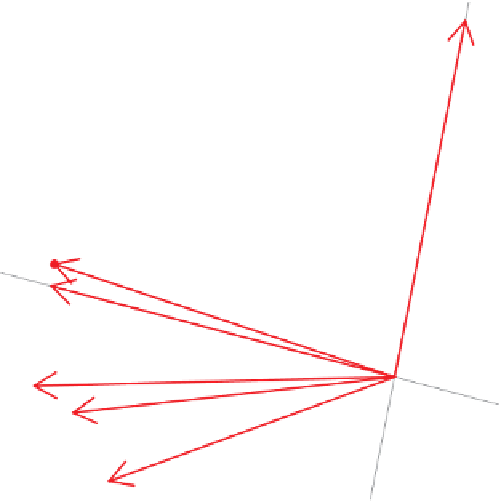
Figure 10.6
Correlation monoplot of the flotation data. The red filled circles represent
the variables as points with coordinates given by
V
J
. The green circle has unit radius.
The tip of each arrow indicates the degree of approximation of each variable, also shown
numerically with the respective labels of the monoplot axes.
Table 10.2
Correlation matrix of the flotation data.
RMOF
RMP
BMSWA
BMCFF
BMCFD
EXFFBB
RMOF
1.0000
0.7547
0.5518
0.8670
0.0761
0.9103
RMP
0.7547
1.0000
0.5087
0.8373
−
0
.
2645
0.7015
BMSWA
0.5518
0.5087
1.0000
0.7234
−
0
.
3165
0.6455
BMCFF
0.8670
0.8373
0.7234
1.0000
−
0
.
2035
0.8633
BMCFD
0.0761
−
0
.
2645
−
0
.
3165
−
0
.
2035
1.0000
0.0321
EXFFBB
0.9103
0.7015
0.6455
0.8633
0.0321
1.0000
on the scale used, as when converting temperatures from Celsius to Fahrenheit, whereas
the standard error changes multiplicatively. Thus, the CV is not invariant to changes in
interval scales. Underhill (1990) propose a CV biplot which is based on the uncentred data
matrix
X
, the means of whose variables are the row vector
1
X
/
n
. These means may be
assembled into a diagonal matrix
,sothat
1
=
1
X
/
n
. The matrix
X
is then replaced by
1
√
n
−
1
(
11
/
−
1
E
=
I
−
n
)
X
.
(10.2)
We note that these quantities are dimensionless, so offer another form of scaling for PCA,
but beware the caveat about interval scales. The diagonals of
E
E
are the squares of the