Information Technology Reference
In-Depth Information
the Burt matrix. The category centroid of the females in Figure 8.16 is well separated
from that of the males. Furthermore, the category centroid of the females is closer to the
category centroids of staff in the lower income deciles, the younger staff, the more junior
staff members, and those staff members with the smallest research output. This stands in
sharp contrast to the category centroid of the males. When the first dimension (horizontal
scaffolding axis) in Figure 8.16 is replaced by the third dimension, the positions of
the category centroids of the males and females almost coincide. We note also large
differences in the positions of the category centroids of the various faculties, with
F
6
quite distant from the rest (in both Figures 8.16 and 8.17). The relative positions of the
CLPs in the Burt matrix based biplot of Figure 8.18 are similar to those in Figure 8.16
but they occupy more peripheral positions relative to the individual sample points.
In Figures 8.19 - 8.21 we give categorical PCA biplots of the
Remunera-
tion.cat.data.2002
data with all variables taken as ordinal categorical except
Faclty
and
Gender
. In these biplots several devices are illustrated for enhancing
Resrch
Remun
R1
R2
R3
R4
R5
R6
R7
R8
R9
R10
Res0
Res2
Res4
Res6
Age
Rank
A1
A2
A3
A4
A5
A6
A7
Rnk1
Rnk2
Rnk3
Rnk4
Rnk5
Gender
AQual
Q1
Q2
Q3
Q4
Q5
Q6
Q7
Q8
Q9
Female
Male
Faclty
F1
F2
F3
F4
F5
F6
F7
F8
F9
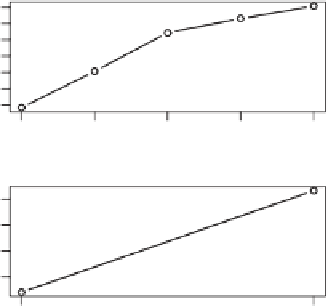
Figure 8.22
Final optimal z-scores for each variable, suggesting that some categories
should be lumped together.