Information Technology Reference
In-Depth Information
Ta b l e 7 . 2 6
Interpolated row predictivities for the Gauteng and Western
Cape provinces.
Period
2001/02
2002/03
2003/04
2004/05
2005/06
2006/07
2007/08
Gaut
0.9224
0.9188
0.9198
0.8796
0.9193
0.9733
0.9844
WCpe
0.2437
0.1410
0.1179
0.4892
0.8473
0.9599
0.9875
Ta b l e 7 . 2 7
Crimes reported in the Western Cape province for period from 2001/02 to
2007/08.
Arsn AGBH AtMr BNRs
BRs
CrJk CmAs CmRb DrgR InAs Mrd PubV Rape RAC
01/02 921
36482
3979 15886 54021
793 47752 14400 13429 1782 3447
248
5115 12300
02/03 960
36122
4843 13197 57399
965 51677 16889 13813 1985 3664
269
4819 14311
03/04 967
36912
3633 11784 54069 1015 52339 14943 19940 2032 2839
268
4664 13855
04/05 720
33869
2490
8950 46977
901 48739 13283 30432 2296 2680
285
5126 13143
05/06 595
28479
1856
7944 41000
965 38226
9387 34788 2236 2750
308
4589 12945
06/07 625
25905
2046 10118 43142
911 35083
8697 41067 2054 2881
406
4217 15226
07/08 629
24915
1844 10639 42376
923 32663
8578 45985 1850 2836
257
4000 14555
Rape
InAs
CrJk
0.005
CmAs
0.01
0.04
0.004
05
AGBH
0.02
06
CmRb
0.02
04
PubV
0
DrgR
0.005
0.1
0
03
07
02
08
0.004
Arsn
0.02
0.005
AtMr
0.02
0.02
BRs
0.04
BNRs
Mrd
RAC
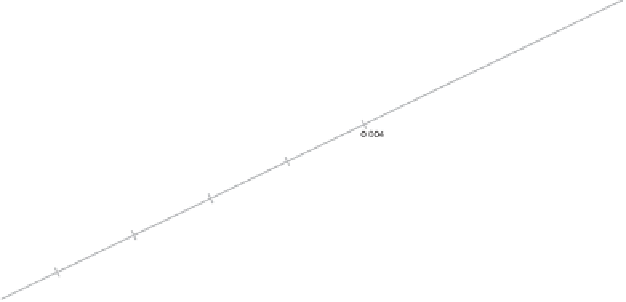
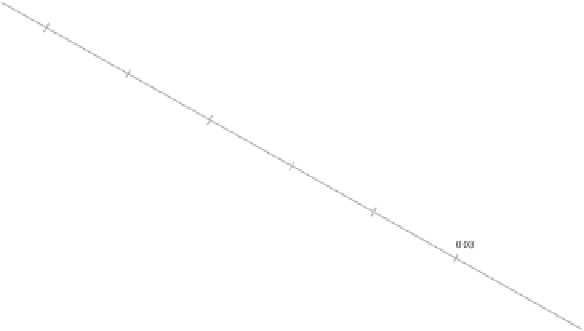
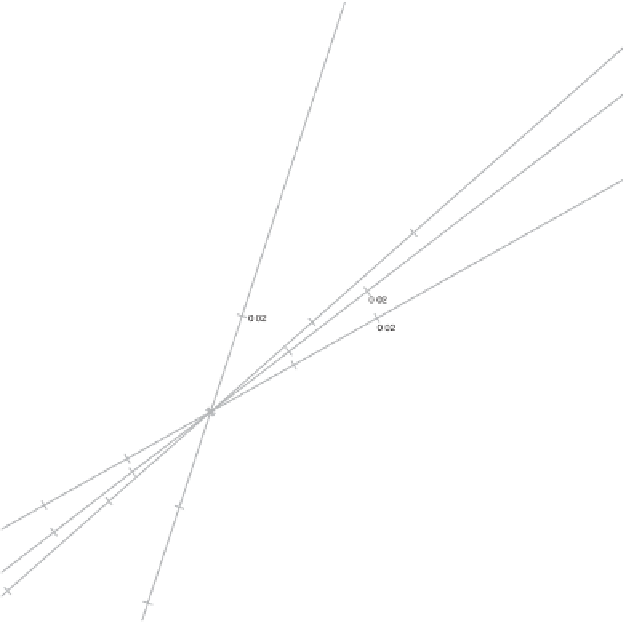
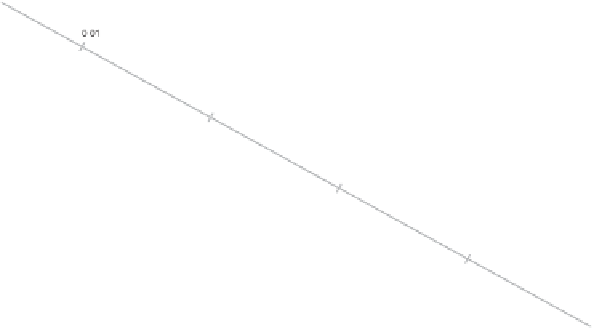
Figure 7.25
Pearson residuals case A CA biplot of the crime data for the Western Cape
province for the period from 2001/02 to 2007/08.


