Information Technology Reference
In-Depth Information
0.1
0.15
0.1
RAC
0.05
Gaut
AtMr
CrJk
0.01
0.05
CmRb
KZN
0.02
InAs
DrgR
AtMr
DrgR
CmRb
0.02
InAs
PubV
0.2
CmAs
WCpe
0.01
07
0
0.1
CmAs
Arsn
Mrd
BRs
BNRs
Mpml
05
03
Rape
NWst
FrSt
0.005
NCpe
Limp
0.01
0.05
ECpe
0.005
0.02
AGBH
Arsn
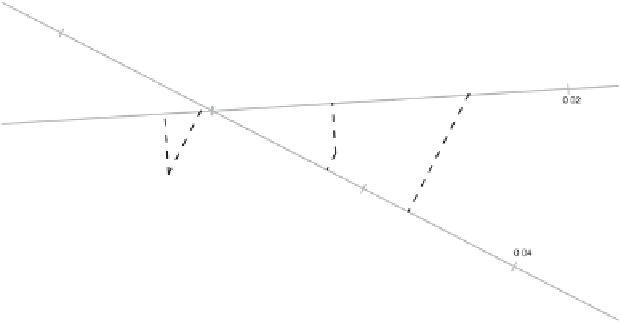
Figure 7.24
Pearson residuals case A CA biplot of the 2007/08 crime data with the
interpolated points together with their predictions for the Western Cape province for the
periods 2002/03, 2004/05 and 2006/07.
cabipl (X = Table.7.2.data, ca.variant = "Chisq2Rows",
markers = F, offset = c(-0.1, 0.2, 0, 0.25),
plot.col.points = FALSE, pos = "Hor", show.origin = TRUE,
zoomval = 0.025)
cabipl.doubling(X = Table.7.2.data, N = 100, ca.variant =
"Chisq2Rows", markers = F, offset = c(3, 2.75, 0.21, 0.21),
offset.m = c(-0.1, -0.1, -0.3, -0.1, -0.1, -0.1),
plot.col.points = FALSE, show.origin = TRUE, zoomval = 0.05)
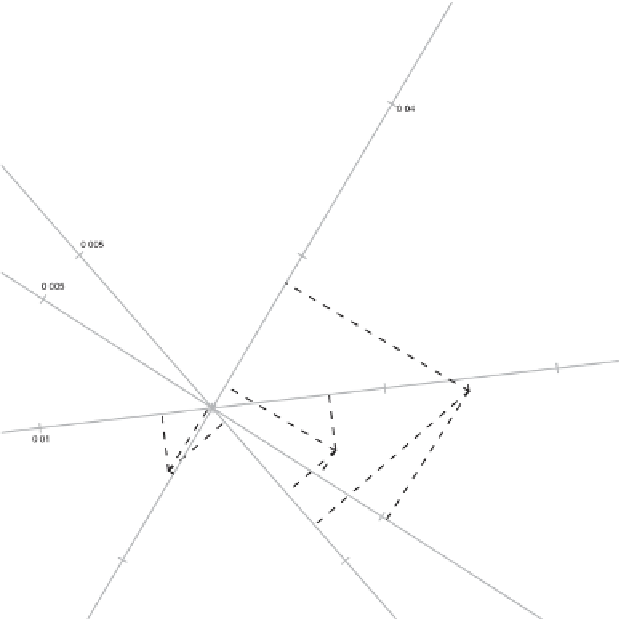
Figure 7.33 gives the approximation to the column chi-squared distances of Table 7.2
before doubling, and Figure 7.34 after doubling. These figures are obtained by making