Information Technology Reference
In-Depth Information
0.1
0.15
0.1
RAC
0.05
Gaut
AtMr
0.01
CrJk
0.05
CmRb
0.02
KZN
DrgR
InAs
08
AtMr
DrgR
CmRb
07
0.02
InAs
0.2
CmAs
0.01
0
WCpe
0.1
0
06
PubV
Mrd
0
CmAs
Arsn
BR
BNRs
Rape
05
03
04
Mpml
02
NWst
NCpe
FrSt
Limp
ECpe
0.005
0.01
0.05
0.005
0.02
AGBH
Arsn
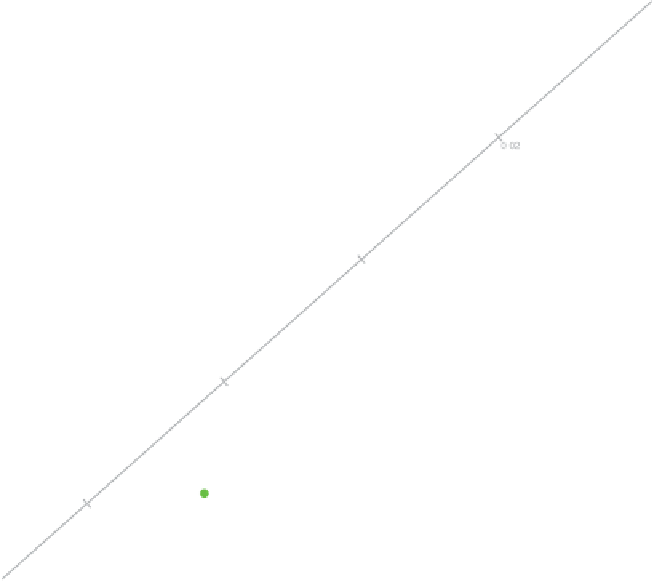
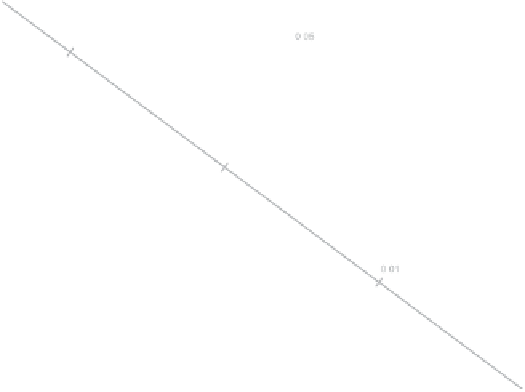
Figure 7.22
Pearson residuals case A CA biplot of the 2007/08 crime data with the
interpolated points for the Western Cape province for the periods 2001/02, 2002/03,
...
,
2007/08.
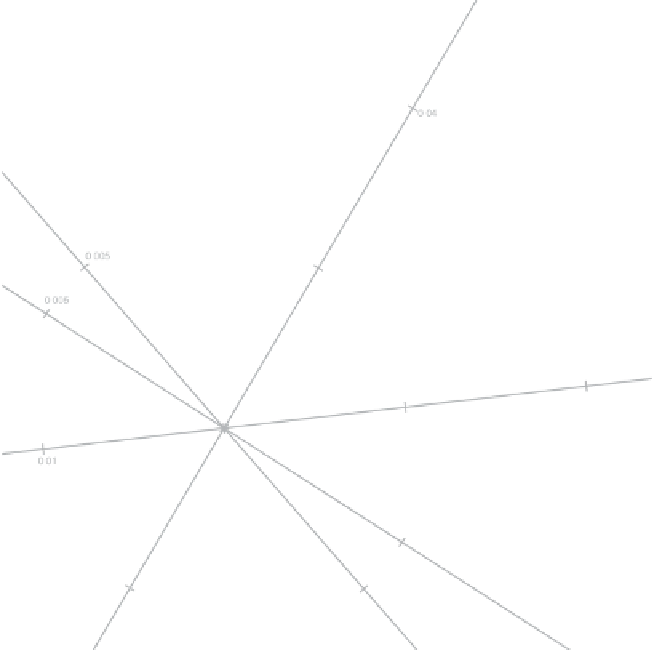
Figure 7.30. This figure looks remarkably similar to those obtained by specifying one of
the other alternatives for the argument
ca.variant
. A quality of display of 87.56% is
obtained. We leave as an exercise to the reader to find the column predictivities and row
predictivities with our function
ca.predictivities
.
7.6.3 Doubling in a CA biplot
The effect of doubling on chi-squared distance in CA was discussed in Section 7.4. We
use the artificial example of Table 7.2 to illustrate the method. Figure 7.31 shows a