Information Technology Reference
In-Depth Information
RAC
AtMr
0.1
0.02
CmRb
0.
005
Gaut
0.02
0.05
0.01
CrJk
0.01
InAs
KZN
DrgR
CmRb
AtMr
InAs
PubV
Mrd
DrgR
0.004
0.2
0
0
WCpe
0.002
0.1
CmAs
Arsn
BNRs
CmAs
BRs
0.02
Rape
Mpml
NWst
0.05
0.002
FrSt
Limp
ECpe
0.01
0.004
0.1
NCpe
0.001
0.01
0.02
AGBH
0.15
Arsn
PubV
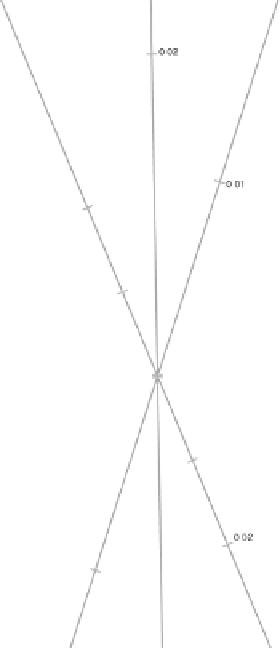
Figure 7.18
Two-dimensional CA biplot of the 2007/08 crime data set. Approx-
imating the row profiles
R
−
1
(
X
-
E
) by plotting
R
−
1
/
2
U
2
(case
A) with arguments
ca.variant = RowProfA
;
RowProf.scaled.markers = FALSE
(the default);
lambda = TRUE
. (Lambda evaluates to 311.9243, indicating that setting
lambda = FALSE
would result in a biplot in which all the row points are squeezed into
one another with the column points more spread out.) Calibrations on axes are in the
form of deviations from the marginal row profile.
1
/
2
1
/
and
C
1
/
2
V
From Table 7.31 it follows that while
DrgR
has a high two-dimensional axis predic-
tivity, those for
Arsn
,
AtMr
,
BRs
,
CmAs
and
Mrd
are all very low. In Table 7.32 we see
that both
KZN
and
WCpe
have low row predictivities in 2002 but high values in 2008.
This raises the question of what the positions of
KZN
and
WCpe
would have been if the
2002 data had been considered on their own. The Pearson residuals case A CA biplot for
2001/02 given in Figure 7.27, with an overall quality of 85.20%, provides the answer.