Information Technology Reference
In-Depth Information
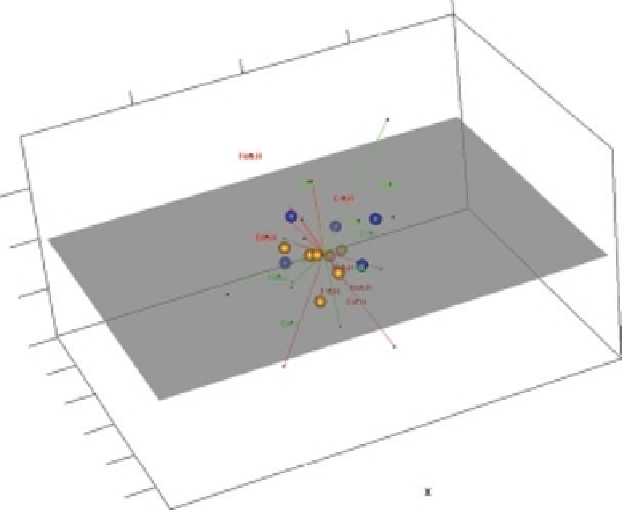
Figure 6.15
Screenshots from three-dimensional biplot of the interaction matrix of the
wheat data after the SVD
Z
=
U
V
. In the top panel varieties are plotted from the first
three columns of
U
1
/
2
1
/
2
. In the bottom
and sites from the first three columns of
V
panel sites and varieties switch roles.