Information Technology Reference
In-Depth Information
−
100
0
100
−
100
Cra.H(58)
−
50
Tem
0
−
80
Fow.H(12)
Ran
Edn.L(88)
50
Beg.L(80)
350
50
−
20
Kin
Cra.L(62)
−
100
−
50
50
Ear.H(15)
Spo
300
300
Edn.H(71)
−
50
0
250
T95
40
−
150
250
−
50
150
200
−
Hob
0
150
20
200
T64
0
0
−
200
T68
−
200
150
Dur
−
20
Hun
−
100
Cap
Fun
100
50
50
−
100
−
50
−
40
0
Ear.L(29)
−
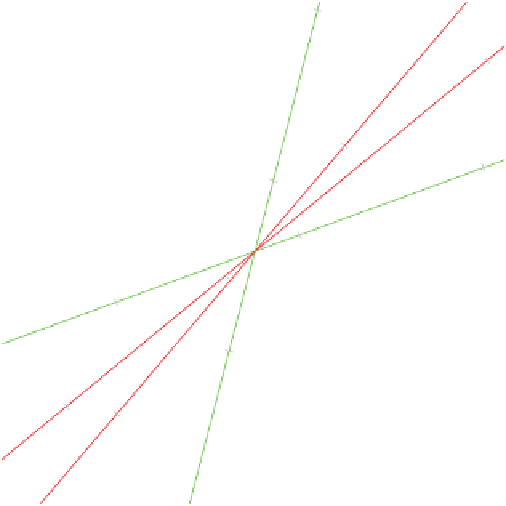
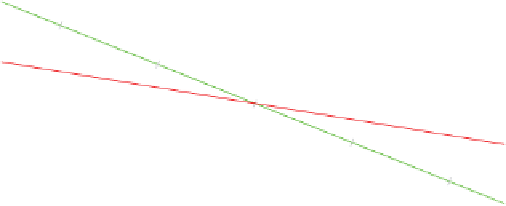
Figure 6.10
Using circular projection to show all interaction predictions pertaining
to variety
Ran
. Note that the main effects, indicated by black solid circles, are all
superimposed at the origin.
Ta b l e 6 . 6
Interaction predictions for site
Fow.L
and variety
Ran
.
Interaction predictions
Interaction predictions
for variety
Ran
for site
Fow.L
Cra.L(62)
−
180.51
Cap(72)
−
64.42
Cra.H(58)
−
54.01
Ran(53)
3.96
Beg.L(80)
−
171.14
Hun(62)
−
65.54
Beg.H(48)
18.71
Tem(93)
47.61
−
48.55
Fow.L(53)
Kin(75)
31.28
−
Fow.H(12)
14.65
Fun(58)
66.92
−
−
Tru.L(21)
74.23
Dur(43)
11.56
Tru.H(71)
−
11.07
Hob(78)
61.20
Box.L(62)
−
70.30
Spo(44)
61.07
Box.H(83)
−
58.91
T95(8)
25.86
Ear.L(29)
67.77
T64(30)
−
23.69
Ear.H(15)
19.60
T68(15)
1.17
Edn.L(88)
300.55
Edn.H(71)
247.45