Information Technology Reference
In-Depth Information
obtained with a call to
biad.predictivities
and are given in Table 6.5. The overall
quality of the biplots in Figure 6.4 is 61.58%, showing that the interactions are less well
represented in two dimensions than are the main effects. The two biplots in Figure 6.5
are shown separately; we could have incorporated both sets of axes in a single biplot,
but it does not help with intelligibility and therefore is not recommended.
−
100
0
100
−
100
−
50
Cra.H(58)
Tem
0
−
80
Fow.H(12)
Edn.L(88)
50
Beg.L(80)
Ran
−
50
350
20
Kin
−
100
Cra.L(62)
−
50
50
Spo
Ear.H(15)
300
300
Edn.H(71)
−
50
250
0
−
150
40
T95
250
−
50
−
150
200
−
60
Hob
0
150
20
200
T64
0
0
−
200
−
200
T68
150
Dur
−
20
−
100
Hun
Cap
Fun
100
50
−
100
50
−
50
−
40
0
Ear.L(29)
(a)
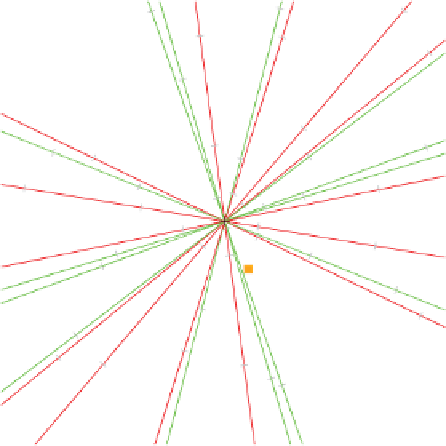
Figure 6.7
Similar to the biplot in the top panel of Figure 6.6 but with sites main
effects added by calling the function
biadbipl
with argument
add.maineffects =
TRUE
. Note that the scales on the biplot axes have changed to reflect the role of the
main effects. The main effects can also be shown on the biplot axes. This can be imple-
mented by setting argument
show.maineffects = TRUE
when calling
biadbipl
.All
main effects are shown as solid black circles on the respective biplot axes. In (a) these
black circles lie on top of one another, coinciding with the origin, and are therefore
not explicitly visible. In the biplot in (b) the point of concurrency of the axes has
been translated in order to improve the display of the biplot. Specifying in
biadbipl
the argument
select.origin = TRUE
allows the user to indicate by means of the
mouse the preferred point of concurrency of the axes. The position of the origin can
be marked with a cross by specifying
show.origin = TRUE
. Notice how the black
circles indicating the respective main effects have moved together with the axes and are
now readily appreciated. Unlike the biplot in the top panel of Figure 6.6, only the row
points and columns as axes are shown; plotting of the column points is suppressed by
specifying
plot.col.points = FALSE
and
col.points.text = FALSE
in the call
to
biadbipl
.