Information Technology Reference
In-Depth Information
Fow.L(53)
Beg.H(48)
Cra.H(58)
−
50
Tem
50
−
50
−
20
50
−
40
50
−
50
Beg.L(80)
Fow.H(12)
Ran
Edn.L(88)
Cra.L(62)
Kin
−
20
50
50
Ear.H(15)
50
Spo
20
Edn.H(71)
50
T95
Sites bundled together
Hob
0
−
50
T64
−
50
T68
−
100
Dur
−
20
20
Hun
Cap
50
Fun
−
50
Ear.L(29)
20
−
50
50
Tru.H(71)
Box.H(83)
Tru.L(21)
Box.L(62)
T68(15)
Fun(58)
Dur(43)
50
−
20
Box.H
−
50
−
100
20
Hun(62)
50
50
−
50
Tru.H
−
50
Box.L
T64(30)
Cap(72)
−
50
50
Tru.L
Ear.L
20
Varieties bundled together
0
50
Ear.H
0
Hob(78)
Fow.H
Cra.L
Beg.L
Edn.H
−
50
−
20
Cra.H
50
Edn.L
50
Spo(44)
Beg.H
−
50
T95(8)
−
100
Fow.L
−
20
−
50
Tem(93)
Ran(53)
Kin(75)
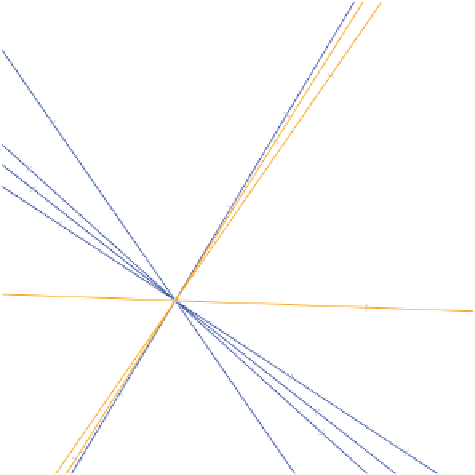
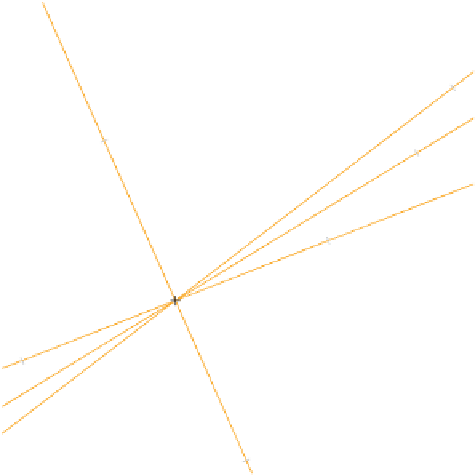
V
of the wheat data
(Table 6.2) with sites as biplot axes in the top panel and varieties as biplot axes in the
bottom panel. The quality of the display is 61.58%. The scales on the axes are in terms
of interactions (see Table 6.2). Note that all axes pass through zero, coinciding almost
with the position of the sites in the top panel and the varieties in the bottom panel.
Figure 6.5
Biadditive biplots of the interaction matrix
Z
=
U