Information Technology Reference
In-Depth Information
0.2
r
RGF
5.5
SLF
g
c
3
0.3
h
5
2.5
i
f
p
q
2
m
d
j
2
4.5
1.5
u
v
e
k
n
1
0.4
w
s
t
4
0.5
4
a
b
6
PLF
SPR
0.5
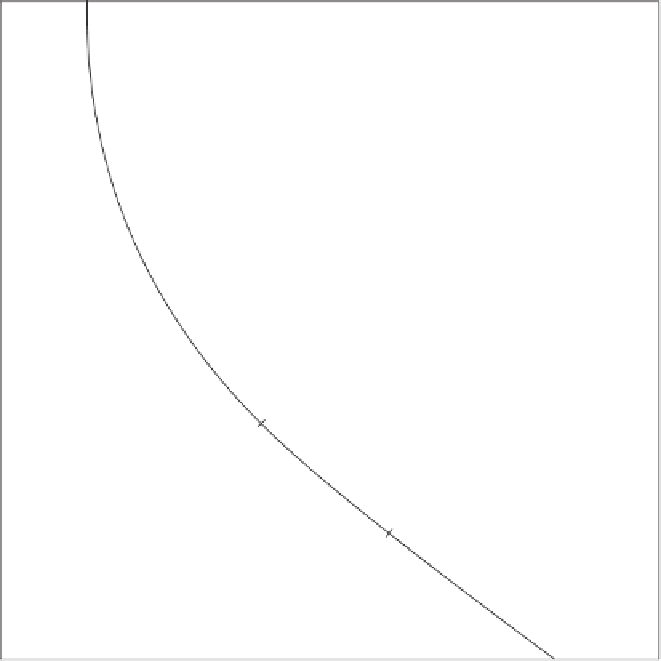
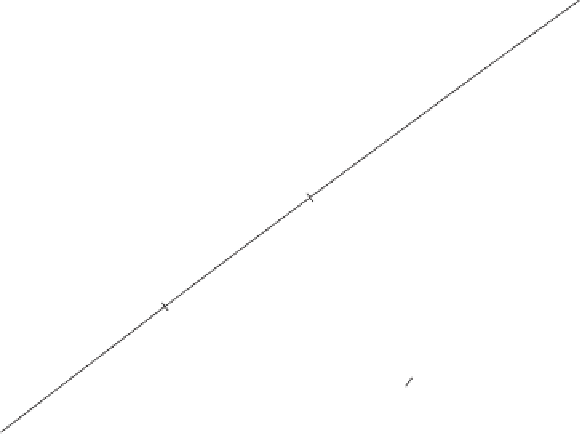
Figure 5.31
Nonlinear biplot based on Clark's distance for aircraft data with back-
projection prediction biplot trajectories.
At every sample point there is an abrupt change - that is, every time we calculate (5.16)
for
µ
=
x
ik
.As
µ
varies, we see the sharp bends in the prediction biplot axes at each of
the points where
µ
=
x
ik
.
5.8 Analysis of distance
We saw in Chapter 4 how CVA gives a useful method for describing and assessing the
differences between the means of
K
groups. In this chapter, so far we have seen how
the ideas of PCA can be generalized to cope with nonlinear distances. In this section we
show how a similar generalization can be made when handling grouped data. In CVA a
key concept has been the use of Mahalanobis distance. In Section 4.1 the PCA biplot of
the
Ocotea
data was compared to the CVA biplot which takes the grouping into account
(see Figures 4.1 and 4.2). A fairer comparison would have been to perform a PCA on
the group means and interpolate the individual samples into this space. This is illustrated
in Figure 5.33.