Information Technology Reference
In-Depth Information
All that is needed to obtain a PCA biplot with
Nonlinbipl
is to specify the distance
as
"Pythagoras"
. The reader can verify that changing
prediction.type
from
"circle"
to
"normal"
or to
"back"
does not change the appearance of the biplot in
the bottom panel of Figure 5.25. Although both the above functions can be used for
PCA biplots, we recommend the use of
PCAbipl
because of its superior facilities for
fine-tuning a PCA biplot.
5.7.2 Nonlinear interpolative biplot
Calling
Nonlinbipl
with
X = aircraft.data[,2:5]
and
ax.type = "inter-
polative"
while
dist
is assigned
"Pythagoras"
or
"SqrtL1"
or
"Clark"
,the
nonlinear interpolative biplots given in Figure 5.26 are obtained.
q
c
p
j
r
m
g
h
r
SLF
c
i
q
3
3.5
j
p
k
SLF
g
RGF
u
m
k
3.5
u
2.5
v
6
h
i
d
e
t
3
2
5.5
t
5
5.5
RGF
n
n
2.5
d
3
3.5
4
4.5
v
f
1.5
e
2
s
w
4.5
1
1.5
f
a
b
1
0.5
4
0
3
2
4
0.5
0.4
PLF
s
0
0.1
0.2
0.3
0.4
a
b
0
w
2
4
6
SPR
6
8
SPR
10
r
0.1
g
3.5
4
SLF
2
1.5
2.53
1
d
6
RGF
0.5
3
PLF
2
SPR
0.4
0.4
4
6
8 10
c
q
h
i
v
e
f
0.1
j
u
p
d
e
m
s
t
PLF
0.3
0.
4
w
k
n
0.3
0.2
0.2
a
b
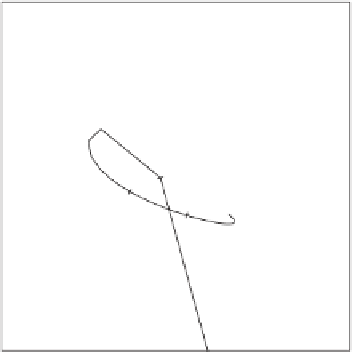
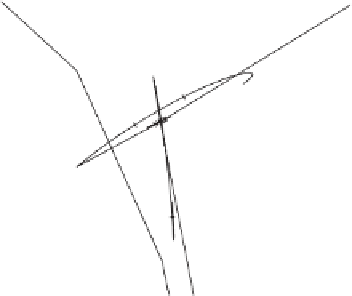
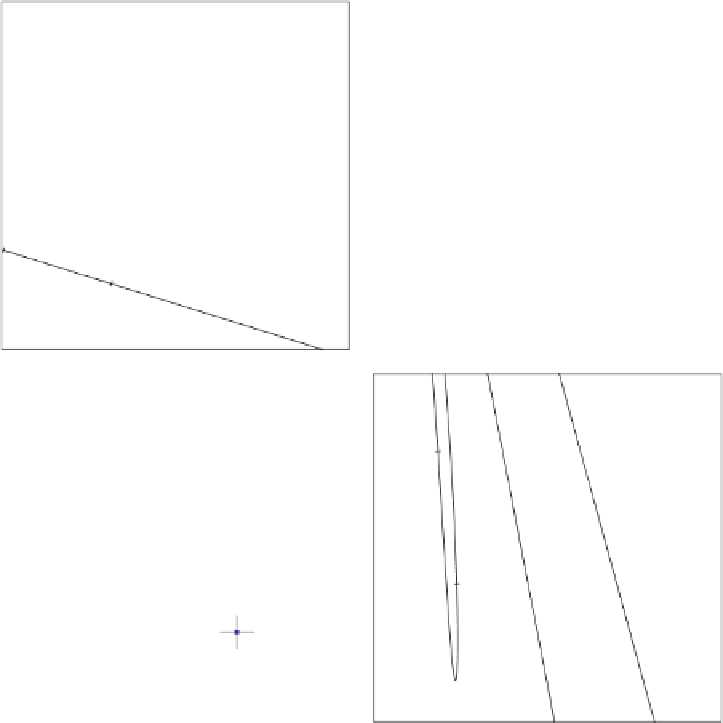
Figure 5.26
Interpolative nonlinear biplots of the aircraft data: (top left) Pythagorean
distance; (top right) square root of Manhattan distance; (bottom left) Clark's distance
(after adding 0.0001 to the data matrix); (bottom right) zooming into the positions of
aircraft
d
and
e
in the bottom left panel biplot.