Information Technology Reference
In-Depth Information
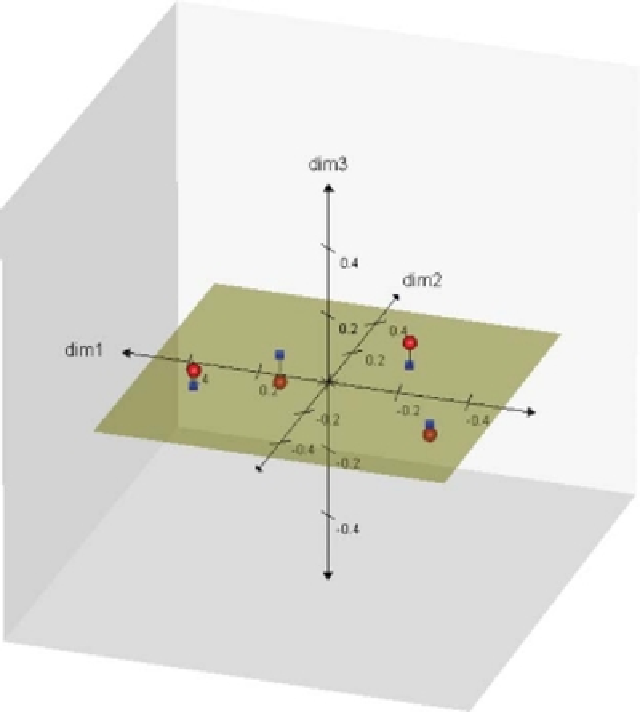
Figure 5.8
Two-dimensional space with projected samples contained in the (5.8) data
matrix
X
being shown.
and
y
m
+
1
=
n
2
1
D1
−
1
n
1
d
n
+
1
−
y
y
.
2
(5.10)
Note that in (5.9) and (5.10) the matrix
m
excludes the last singular value of
zero as well as the corresponding column of
Y
,thatis,the
Y
in(5.9)isofsize
m
:
m
×
n
.
Although every embedded sample creates a new extra dimension, Gower and Hand
(1996) give arguments why we may proceed as if there were only one extra dimen-
sion; the version of
R
augmented with this extra dimension will be denoted by
R
+
.
Distances calculated between any point in
R
and a point in
R
+
will be correct, but
distances between points that are both in
R
+
might not be. Since the extra dimension is
orthogonal to the first
m
dimensions, the orthogonal projection of the new sample onto
the
m
-dimensional subspace
R
⊂
R
+
is given by (5.9).
The original variables, axes
X
and
Y
, in our example in Figure 5.3 are embedded
into
R
by calculating the distance vector
d
n
+
1
from the pseudo-sample
x
∗
=
µ
×
e
k
for