Information Technology Reference
In-Depth Information
Ta b l e 4 . 2 5
Class predictivities of the CVA biplot of the education data.
Weighted CVA
Black
Coloured
Indian
White
Dim_1
0.9991
0.9534
0.8356
0.9902
Dim_2
0.9995
0.9683
0.9969
0.9997
Dim_3
1.0000
1.0000
1.0000
1.0000
Weighted
I
CVA
Dim_1
0.9836
0.9593
0.9266
0.9440
Dim_2
0.9988
0.9604
0.9999
0.9998
Dim_3
1.0000
1.0000
1.0000
1.0000
Weighted
I
-
K
−
1
11
Dim_1
0.9983
0.8844
0.7166
0.803
Dim_2
0.9983
0.9042
0.9996
0.999
Dim_3
1.0000
1.0000
1.0000
1.0000
EducY (0.93)
12
−
5
15
0
10
16
14
110
12
5
8
6
8
4
2
10
0
2
−
6
15
16
4
20
Black1993; n = 605
Black2006; n = 1500
Colrd1993; n = 90
Colrd2006; n = 1336
Indian1993; n = 19
Indian2006; n = 179
White1993; n = 85
White2006; n = 447
25
ParEdY (1)
Age (0.44)
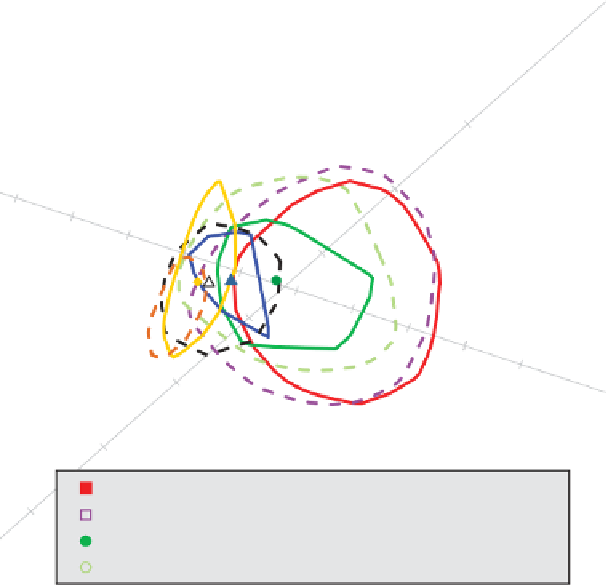
Figure 4.25
Quantifying overlap in the education data by using
α
-bags added to a CVA
biplot.