Information Technology Reference
In-Depth Information
platfang
pointwth
pointlng
platfang
pointwth
pointlng
70
180
platfwth
110
70
180
platfwth
110
160
60
160
60
60
60
140
100
140
platfthk
100
50
platfthk
50
120
50
pointthk
120
pointthk
50
20
20
40
100
40
100
90
15
40
90
ratio
15
40
80
80
ratio
30
40
30
30
40
20
10
30
10
10
20
0
10
80
0
30
20
80
5
20
40
40
5
20
0
20
10
20
20
10
70
0
70
−
5
0
0
10
0
0
0
−
5
10
0
60
60
0
0
0
platfang
pointwth
pointlng
platfang
pointwth
pointlng
70
180
70
180
110
platfwth
platfwth
110
160
60
160
60
60
60
140
140
100
platfthk
100
50
platfthk
50
pointthk
50
120
120
50
pointthk
20
20
40
100
40
100
90
90
15
40
ratio
15
40
ratio
80
40
80
30
30
20
40
30
10
10
30
10
0
10
20
10
10
0
30
80
30
80
20
20
40
5
40
5
MSAI; n
59
MSAIILOWER; n
=
407
MSAIIUPPER; n
=
20
20
10
20
0
10
20
70
0
70
=
245
0
0
0
10
0
−
5
0
10
0
−
5
60
60
0
0
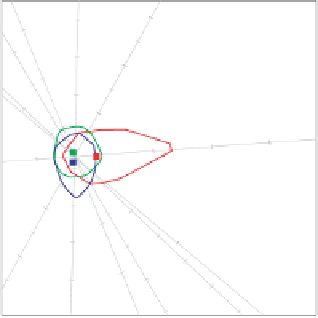
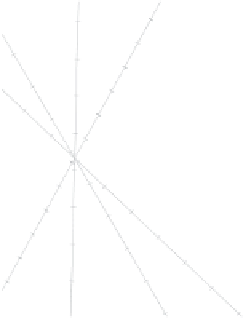
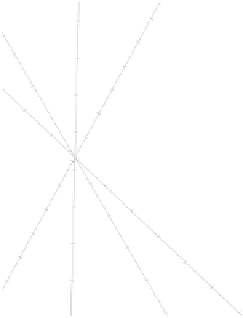
Figure 4.23
CVA biplot of the archaeological data set, fitted with: (top left) 0.40-bags;
(top right) 0.60-bags; (bottom left) 0.80-bags; (bottom right) 0.95-bags.
It is clear from the biplots in the top panel of Figure 4.24 that there are large
differences between the four groups with respect to all the variables with the excep-
tion of age. To gain insight into these differences, we equipped the biplot with
α
-bags
for various values of alpha. The reader can verify that by choosing
α
=
0
.
50, for example,
bags are obtained such that there is no overlap between the black and the white groups,
while the bag for the coloured group is situated between these two groups, overlapping
with both. In order to quantify the separation among the different groups, we look for
the smallest value of
α
such that all the groups overlap. The biplot in the top right panel
of Figure 4.24 shows that this happens when
α
=
0
.
65, thus enclosing the inner (with
respect to the Tukey median) 65% of the multidimensional samples from each group.
For this value of
α
the bags for the black and white groups barely touch each other.
Instead of
α
-bags,
κ
-ellipses about each group mean are constructed in the biplot in the
bottom left panel of Figure 4.24 where, for the purpose of comparison, we have chosen
the value of
such that the ellipse encloses 65% of the sample values. Because of the
canonical transformation, we expect the kappa ellipses to be circular. This is true for
κ


