Information Technology Reference
In-Depth Information
0
0
40000
1.1
200
5000
5
30000
1.05
5500
300
20000
10
6000
1
400
10000
15
6500
0
500
20
0
.95
33.5
33
32.5
32
7000
25
600
7500
0.9
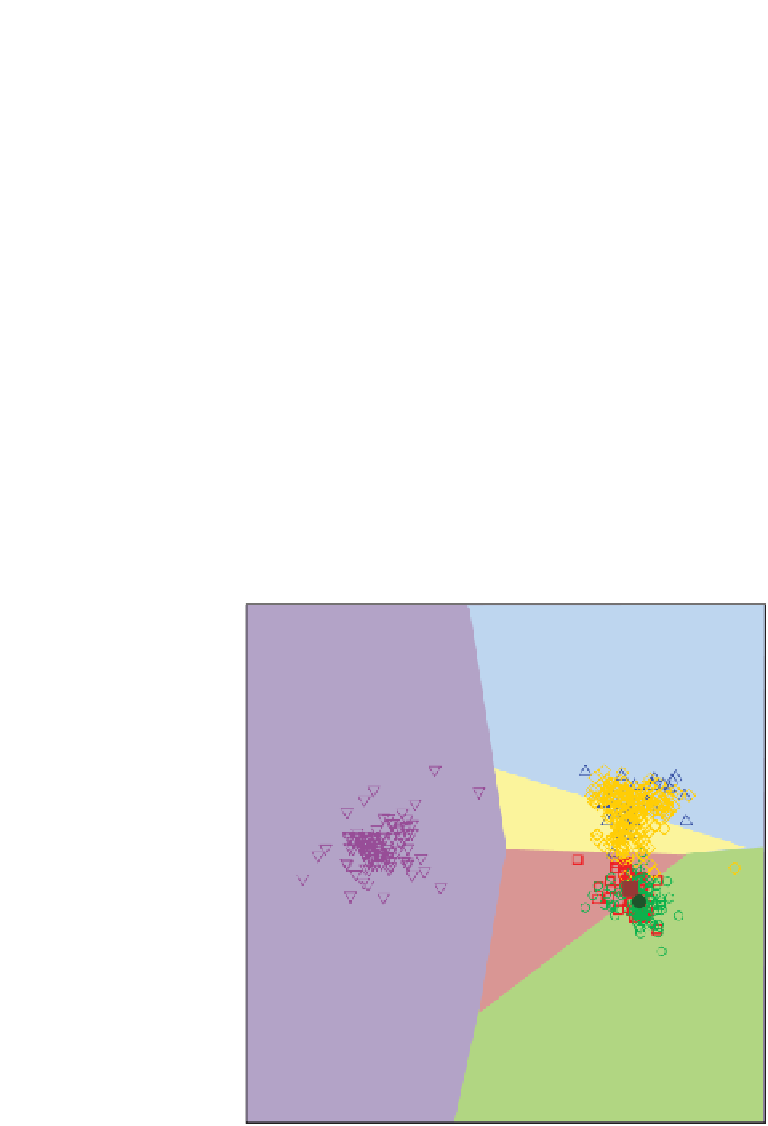
Figure 4.22
CVA biplot of copper froth data equipped with classification regions. (Top)
Distance between point in biplot space and mean in full space. (Bottom) Distance between
point in biplot space and mean also in biplot space.