Information Technology Reference
In-Depth Information
RayW
VesD
180
RayH
300
160
500
40
140
450
1000
120
10
1200
15
400
NumVes
1400
400
1600
100
1800
FibL
350
30
80
Obul; n
=
20
Oken; n
=
7. (C hull)
Opor; n
=
10
VesL
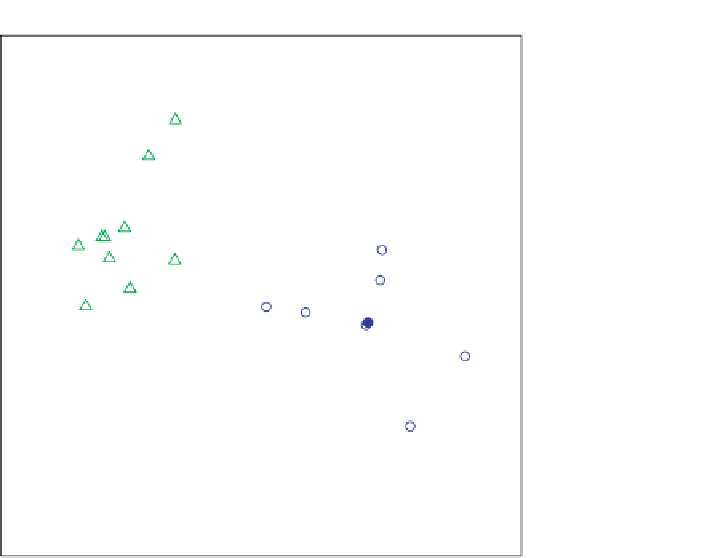
Figure 4.2
CVA biplot of the
Ocotea
data set with six variables. Group means are
indicated by solid symbols according to the key included. 0.95-bags are shown.
For reference purposes and to be used when comparing different methods later on,
we give the mean values and standard deviations of each of the variables by species
in Table 4.1. This table shows considerable differences in the mean values of the three
species for each of the wood anatomical features, but the standard deviations show that a
considerable amount of overlap between the samples from the three species can also be
expected. A formal test of equality of covariance matrices rejects the null hypothesis at
the 5% significance level. Thus any statistical method for investigating group differences
depending on the assumption of equal covariance matrix should be regarded with caution.
Ta b l e 4 . 1
Mean values and standard deviations of wood anatomical features for each
of the three species of the genus
Ocotea
.
Species
Statistic
VesD
VesL
FibL
RayH
RayW
NumVes
(
µ
m)
(
µ
m)
(
µ
m)
(
µ
m)
(
µ
m)
O. bullata
Mean
98
.
10
412
.
00
1185
.
40
375
.
40
32
.
30
14
.
30
SD
18
.
76
94
.
17
140
.
40
69
.
22
7
.
730
6
.
01
O. kenyensis
Mean
137
.
30
401
.
70
1568
.
90
446
.
10
37
.
30
9
.
10
SD
20
.
54
53
.
54
120
.
93
42
.
22
4
.
50
1
.
95
O. porosa
Mean
129
.
30
342
.
40
1051
.
70
398
.
20
39
.
40
14
.
80
SD
11
.
80
87
.
76
55
.
94
67
.
08
4
.
72
3
.
52