Information Technology Reference
In-Depth Information
20
0
100
5
200
VesD (0.17)
FibL (1)
30
140
1800
300
10
1600
1400
120
350
1200
400
400
1000
450
15
RayH (0.3)
100
500
500
40
NumVes (0.33)
600
700
800
RayW (0.16) VesL (1)
RayW (0.84)
NumVes (0.7)
400
60
30
600
VesL (0.29)
25
50
VesD (0.6)
800
500
160
20
1000
140
40
15
500
RayH (0.63)
450
400
120
350
300
250
1200
100
30
10
1400
80
300
1600
5
60
20
Obul; n
20
Oken; n
=
7. (C hull)
Opor; n
=
1800
0
200
=
10
FibL (0.8)
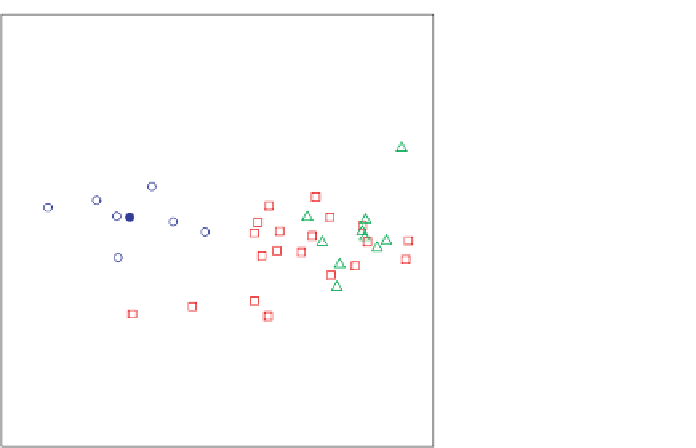
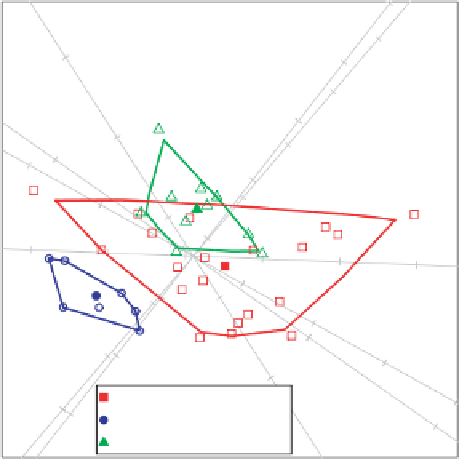
Figure 4.1
PCA biplot of
Ocotea
data: (top) unscaled variables; (bottom) variables
scaled to unit variances.
a PCA biplot is not scale-invariant; secondly,
PCAbipl
allows through its argument
G
information of a predetermined group structure to be incorporated in the biplot. How
this is done is illustrated in Figure 4.1. The top panel of Figure 4.1 shows a PCA
biplot of the unscaled (but centred)
Ocotea.data
; by contrast, the biplot in the bottom
panel is a PCA biplot of the scaled
Ocotea.data
. It is clear that the two biplots are