Information Technology Reference
In-Depth Information
FibL (0.8)
RayH (0.63)
500
1600
VesD (0.6)
5
O.ken
160
VesL (0.29)
450
1400
140
500
10
120
400
RayW (0.84)
1200
15
20
25
30
35
40
45
50
55
15
O.bul
O.por
100
300
350
80
1000
20
60
300
800
25
250
600
30
NumVes (0.7)
RayH (0.63)
500
O.ken
450
Fibl (0.8)
VesD (0.6)
160
400
1400
VesL (0.29)
10
O.bul
140
O.por
500
350
1200
120
400
15
100
300
1000
80
300
20
RayW (0.84)
15
20
25
30
35
40
45
50
55
60
250
800
225
200
200
NumVes (0.7)
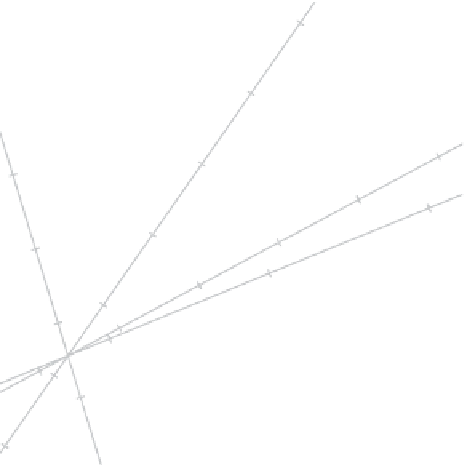
Figure 3.36
Some enhancements to the Figure 3.23 PCA biplot of the scaled
Ocotea
data. In the top panel the biplot is rotated so that the axis with the highest predictivity,
RayW
, is in the horizontal position. In the bottom panel the orthogonal parallel translation
procedure (see Section 2.8) has been called upon by the argument
select.origin =
TRUE
to translate the origin to allow a less obscured configuration of sample points. In
both panels the axis predictivities have been added to the labels of the respective axes.