Information Technology Reference
In-Depth Information
A4 (0.45)
C6 (0.62)
C8 (0.85)
C7 (0.82)
D4 (0.48)
66
32.5
1.8
18
A3 (0.8)
5.6
32
Jul00
1.2
64
1.7
5.4
2.5
1.15
31.5
16
Mar01
62
1.1
3
20
14.2
5.2
1.6
31
1.05
60
3.5
14
1
14.3
30.5
5
20.5
Apr00
1.5
Target
Aug00
49
79
Jun00
D7 (0.72)
B5 (0.89)
45
22
0.95
A5 (0.89)
21.5
28
29
30
26
D6 (0.74)
27
44
58
21
Feb01
30
50
20.5
79.2
43
0.9
4.8
14.4
A2 (0.03)
21
1.4
Dec00
12
Jan01
A1 (0.2)
May00
Sep00
Feb00
0.85
4.5
J
an00
29.5
56
Mar00
Nov00
Oct00
4.6
14.5
0.8
C5 (0.47)
C4 (0.53)
E5 (0.49)
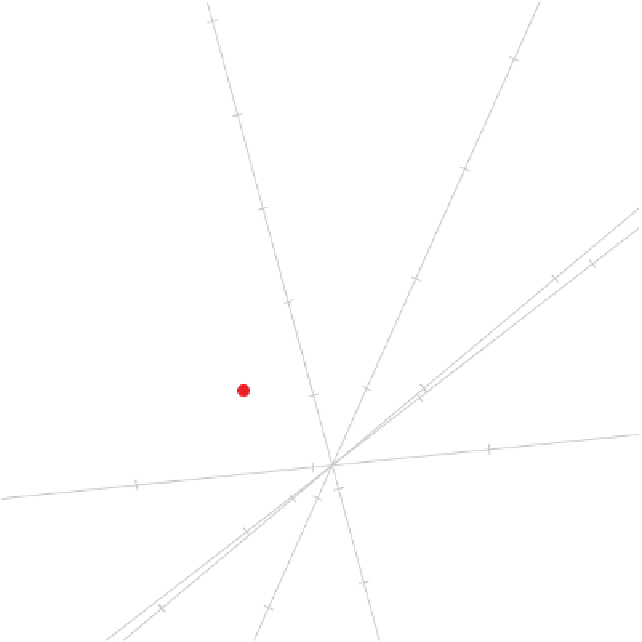
Figure 3.33
PCA biplot of the scaled process quality data with a multidimensional
target interpolated.
characteristics measured at five stages, A, B, C, D and E, in the manufacturing process. A
target value specified by company management for each variable is included in the table.
The PCA biplot of the process quality data (available as R object
ProcessQual-
ity.data
) in Figure 3.33 improves the summary and interpretation of the process. The
target values are interpolated into the biplot as
z
target
=
t
V
r
using formula (3.4) with
t
the scaled target values, to put each month's performance into perspective. The function
call for constructing the Figure 3.33 biplot is
PCAbipl(ProcessQuality.data[-1,], scaled.mat = TRUE, X.new =
matrix(ProcessQuality.data[1,], nrow = 1), colours = "green",
pch.samples = 15, pch.new = 16, pch.new.cols = "red",
pch.new.labels = "Target")
After obtaining the initial biplot several arguments are available (see Section 3.7.1) for
refining the general appearance of the biplot.
The biplot representation of the process quality data shows that on average
Jun00
produced a product much closer to target than did
Jul00
. Since the biplot axes are
concurrent at the centroid, it is clear that over the 15-month period the process was