Information Technology Reference
In-Depth Information
Ta b l e 3 . 1 7
Adequacies and predicitivities for the
two-dimensional biplot of the normalized aircraft data.
SPR
RGF
PLF
SLF
Adequacy
0.4557
0.3824
0.7528
0.4091
Predictivity
0.8124
0.7202
0.9065
0.8118
The overall quality of the two-dimensional PCA biplot is
0
.
8127
=
(
41
.
0083
+
24
.
0087
)/(
41
.
0083
+
24
.
0087
+
9
.
2851
+
5
.
6979
).
Comparing Table 3.17 with the corresponding entries in Table 3.6,
PLF
now becomes
the most adequately approximated variable, with
RGF
the least adequate. It may be
verified from Table 3.17 that the average predictivity agrees with the overall quality of
0.8127. The fit measures for all four dimensions are obtained with the call
PCA.predictivities(aircraft.data[,-1], scaled.mat = TRUE)
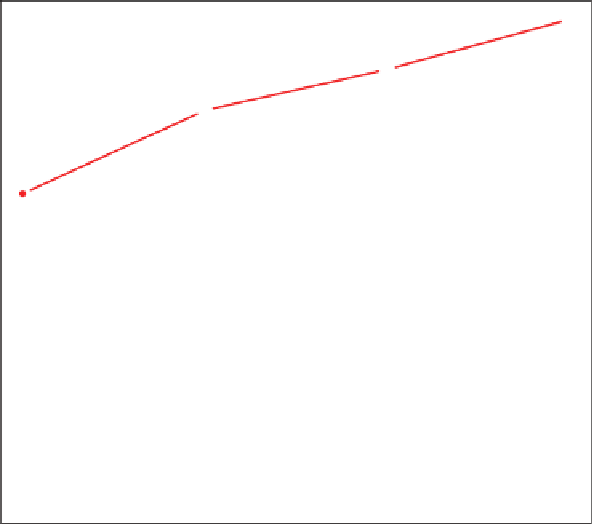
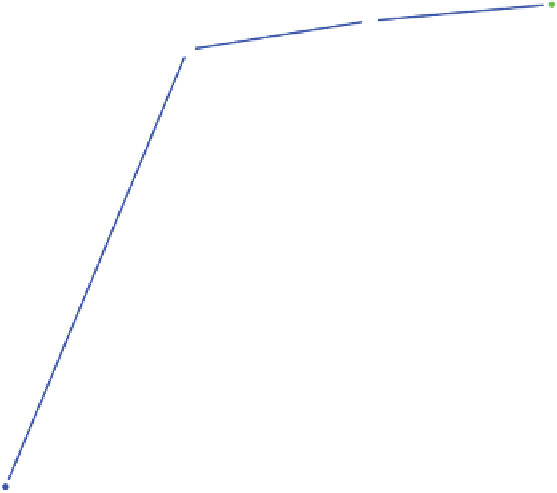
The axis predictivities and quality are summarized in Figure 3.25. Even in one dimen-
sion, all variables start at a gratifyingly high level, except for
PLF
which from a bad start
catches up immediately in the two-dimensional fit. A possible explanation is that most
variables involved with aircraft development improve, which means that they increase
Mean = Quality
SPR
RGF
PLF
SLF
1
2
3
4
Dimension of subspace
Figure 3.25
Plot of axis predictivity against dimensionality for the normalized air-
craft data.