Information Technology Reference
In-Depth Information
think inadvisably, when examining the approximation of
X
. Because
V
is orthogonal,
we attain the maximum adequacy of one when
r
=
p
when the 'approximation' is exact.
This is the basis of methods that plot a unit circle, with the rows of
VJ
represented as
vectors from its centre (see Chapter 10). In Figure 2.9 this vector is shown with the '1sd'
marker (the marker denoting the mean plus one standard deviation) on the biplot axis.
For high adequacy a unit point must lie in or near the
r
-dimensional subspace and for
low adequacy the corresponding variable must be nearly orthogonal to the subspace. The
unit circle indicates 'perfect adequacy' and the further away the '1sd' marker is from the
unit circle, the poorer the adequacy.
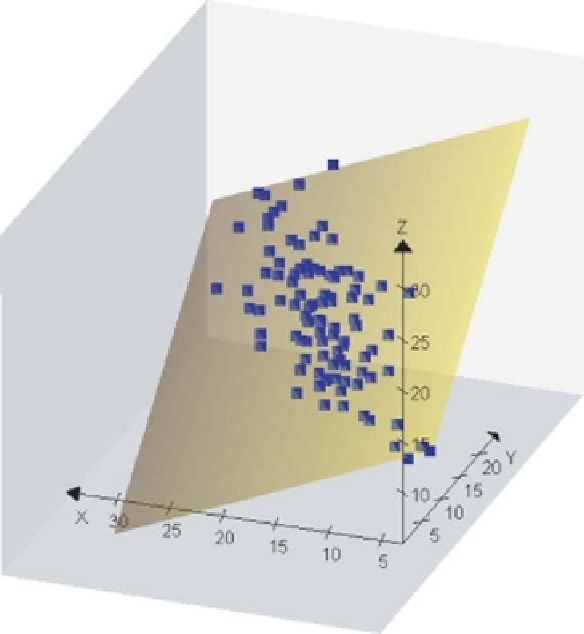
Clearly, the graphical representation in Figure 3.19 described by three variables can-
not represent all variables adequately in two dimensions, whereas the sample points
themselves may be shown perfectly in two dimensions. Therefore, one may be more
interested in how close to the plane are the points represented by the rows of
X
rather
than how close are the axes. A measure termed
predictivity,
described below, has been
designed to address this kind of phenomenon.
For true two-dimensional data as in Figure 2.1, PCA gives an exact two-dimensional
fit (i.e. unit overall quality) and the predictions obtained as projections
X
onto the cali-
brated biplot axes will reproduce the data
X
exactly. Yet, the variables will have varying
Figure 3.19
An artificial three-dimensional data set where all sample points lie on a
plane in the three-dimensional space.