Information Technology Reference
In-Depth Information
0
2
X
4
24
6
22
2
10
5
8
20
24
16
20
9
25
18
10
15
3
6
14
Z
16
12
15
20
25
10
7
8
17
22
14
4
1
14
11
21
18
19
23
12
13
16
10
18
8
12
20
6
22
4
2
24
0
26
Y
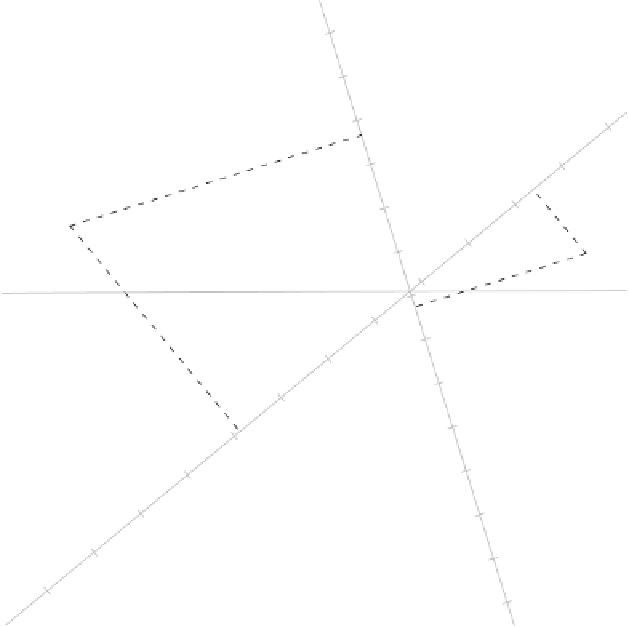
Figure 3.17
Prediction PCA biplot of the data in Table 3.3. Dotted lines show pre-
dictions for samples
9
and
24
as requested by the argument
predictions.sample =
c(9,24)
and
ort.lty = 2
in the function call to
PCAbipl
.
x
x
^
^
x - x
x - x
^
^
(a)
(b)
Figure 3.18
Breakdown of a sum of squares: (a) orthogonal; (b) nonorthogonal.