Biology Reference
In-Depth Information
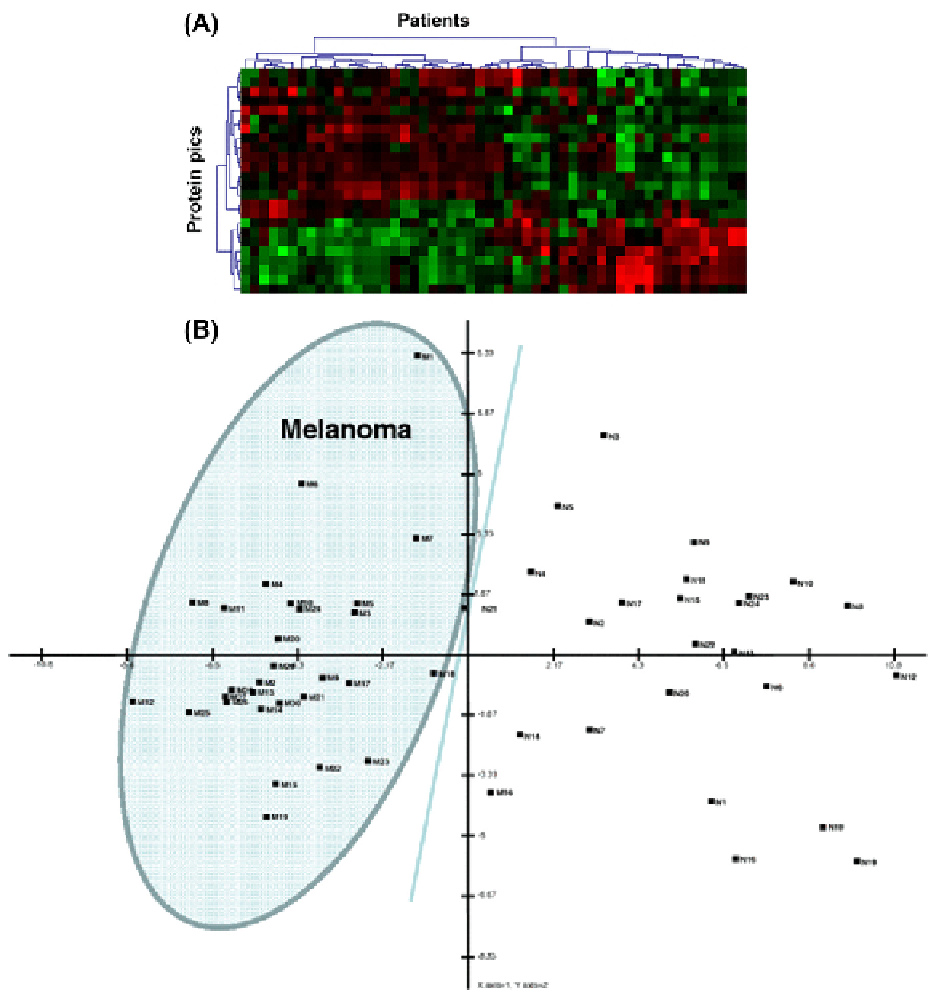
FIGURE 6
Heat cluster map and principal component analysis (PCA) of melanoma and normal samples. All protein peaks
in the 2.5
e
80 kDa mass range were pooled to generate a heat cluster map (A) and PCA diagram (B). The PCA diagram
illustrates the segregated samples based on normal (N) and melanoma (M) samples.
Search WWH ::

Custom Search