Biology Reference
In-Depth Information
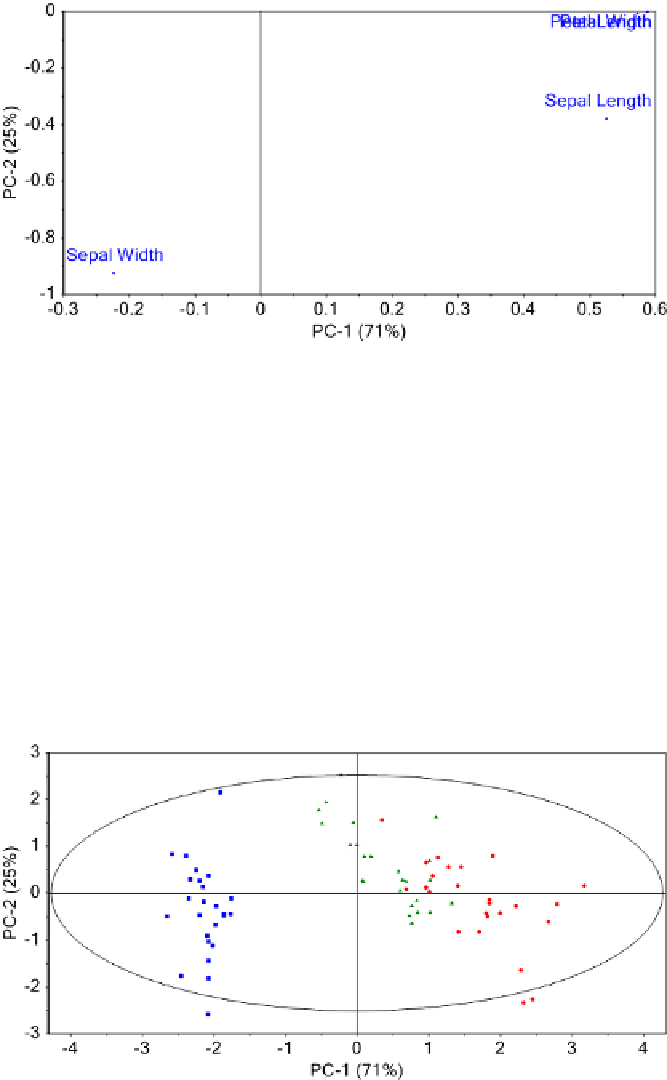
FIGURE 3
Loading plot for the data set in Table 2. The first principal component is plotted on the x-axis and the second
principal component is on the y-axis. Variables that are close to each other are highly correlated. This is the case with the
variables Petal Width and Petal Length, which are overlapping in the loading plot shown.
the data set. For most spectral data sets, a small
number of principal components (also called
factors) can be used to approximate the spectral
data set very well. The determination of the
correct number of factors can be done by
a variety of numerical methods. Too many
factors in the PCA model will over
a suitable number of principal components. The
suggested number is usually a good starting
point; however, it is best practice to verify the
optimum number of principal components
with additional independent test data.
Partial least squares (PLS) is an extension of
PCA in which both the X and Y data are consid-
ered.
8,9
In PCA, only the X data is considered.
The goal of the PLS analysis is to build an equation
t the data
and the model will not predict reliably. Most
multivariate analysis software packages suggest
FIGURE 4
Score plot of the data set in Table 2. The ellipse is the Hotelling
T
2
ellipse at 95% probability level. Samples
outside the ellipse have a probability greater than 95% of being statistical outliers.

Search WWH ::

Custom Search