Environmental Engineering Reference
In-Depth Information
the grid. Given are normalized current, efficiency and power factor over normalized
output power. Note also the slip curve, showing a rated value below 1%. Figure 3.7b
is a representation of current and torque over speed in the interval between inverse
synchronous speed (
s
= 2), with indication of short-circuit at standstill (
s
= 1), and
up to double synchronous speed (
s
=
1). In the torque curve the effect of current
displacement is neglected, hence the graph applies to a wound-rotor machine with
secondary side short-circuited.
The power behaviour of an induction machine can be described taking the differ-
ent loss types into account. Below this is done using the air-gap power
P
δ
−
which is
transmitted electromagnetically between stator 1 and rotor 2.
P
δ
=
P
el
−
P
cu
1
−
P
Fe
−
P
add
P
mech
=
P
δ
(1
P
fw
P
el
=
P
δ
+
P
cu
1
+
P
Fe
+
P
fw
−
s
)
−
;
(3.8)
where
P
cu
1
= 3
R
1
I
1
stator copper losses (in machines with three-phase windings),
rotor
I
2
R
-losses,
·
P
cu
2
=
s
P
δ
P
Fe
,
P
add
,
P
fw
iron loss, additional load loss, friction and windage loss,
respectively.
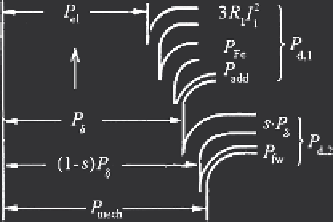
The power and loss situation may be visualized by the Sankey-diagram, which in
Fig. 3.8 is shown for a motor (a) and a generator operation (b).
P
cu1
,
P
cu2
and
P
add
are the load losses, whereas
P
Fe
and
P
fw
belong to the constant (load-independent)
losses. Note that equations 3.11 hold independent of the type of operation as long
as the same notation system; here the consumer (motor) system is used, i.e. values
P
el
,
P
mech
are positive in motor and negative in generator operation. The loss values
are always positive.
The torque
T
can be represented by using the air-gap torque
T
δ
which is related to
the air-gap power. To obtain the shaft-torque it has to be diminished by the friction
torque
T
fw
which represents the friction and windage losses.
a)
b)
Fig. 3.8
Sankey diagrams of induction machines (
a
) motor operation; (
b
) generator operation

Search WWH ::

Custom Search