Environmental Engineering Reference
In-Depth Information
In practice the power curves are determined by test, normally executed in a rec-
ognized testing field. Measurements are taken and recorded between cut-in wind
speed and cut-off, at least up to 18 m/s. A graph is drawn of the electrical active
power
P
together with the power coefficient
c
p
versus wind speed
v
. An example
of a turbine rated 1800 kW at 14 m/s is shown in Fig. 2.16, in form of curves of
power
P
(
v
) and power coefficient
c
p
(
v
). The measurement set-up and quantities to
be recorded are illustrated in Fig. 2.15 [DEWI].
Figure 2.16 is typical for a design where 14 m/s is the specified rated wind veloc-
ity, with a
v
3
power dependence below and a limitation above. The power coefficient
has its maximum at 8 m/s in a region near the average speed.
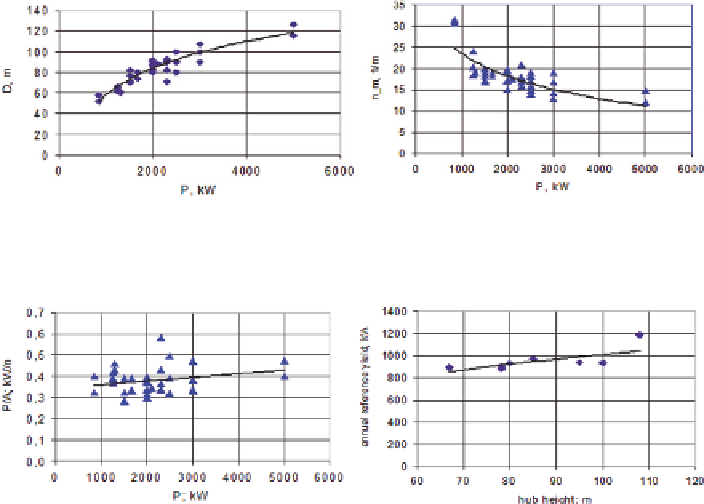
A view on specific power values of currently available WES is given in the next
two figures, based on data supplied by the manufacturers [BWE07], covering rat-
ings of 850 kW and above. They give an insight into the rotor diameters
D
and the
rotor speeds (upper values in case of speed variable systems)
n
m
versus rated power,
Fig. 2.17. Further, Fig. 2.18 shows the specific power, i.e. the ratio of rated WES
power and swept area. According to the trend line the values aggregate between
0,35 and 0
,
45 kW
/
m
2
, with a tendency to increase with increasing rating. The right
part of Fig. 2.18 shows also, for a variety of systems for 2000 kW, the specified spe-
cific reference annual energy yield versus hub hight. Here from the trend line values
in the regieon 900
...
1100 (kWh
/
a)
/
m
2
can be observed. Note that among the data
there are designs for upper as well as for lower average wind velocities.
Fig. 2.17
Rotor diameters and rotation speeds of systems of 850 kW and above
Fig. 2.18
Specific power of systems
>
850 kW and reference energy yield of systems 2000 kW
Search WWH ::

Custom Search