Environmental Engineering Reference
In-Depth Information
a)
b)
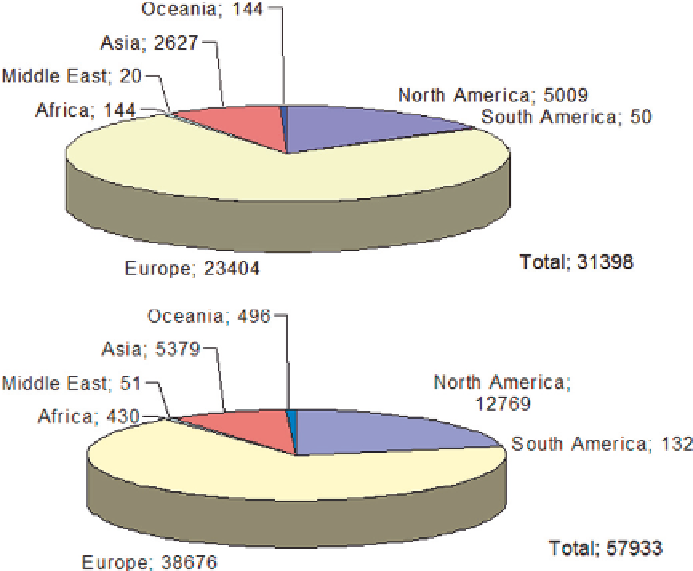
Fig. 1.2
Wind energy installed power ratings and annual output (2002).
(a)
installed capacity, in
MW;
(b)
electric output; in GWh
and the economies of large-scale generation. Sources of progress were technolog-
ical advances in structural analysis and design, sophistication in blade design and
manufacture, and the utilization of power electronics and variable-speed operation
[Ram07]. Hence wind electric conversion is the fastest growing “green” technology.
A survey of the Top 10 countries regarding installed wind energy conversion
capacity is shown in Fig. 1.3 [GWEC07]. Among the countries other than Europe,
USA, India and China are notable for using wind energy with increasing capacities.
Wind reports regarding the 27 member countries of the International Energy Agency
(IEA) per 2006 are collected in [IEA06].
Focussing on the situation in Europe, Table 1.2 gives a list of rated power in MW,
installed during 2006 and total at the end of 2006. Germany is the leading country by
installed wind power, with Spain following, while Denmark is foremost in capacity
per capita. Reported in the table are also the total capacities for the European Union
(EU) of 15 countries, of 25 countries and for total Europe [ewea].
Within the EU the concentration of installed wind power in 10 countries is also
reflected in a European Wind Integration Study (EWIS), Final Report of 2007-01
[EWIS07], see Fig. 1.4.
In a special view on Germany, the percentage of electrical energy supplied by
renewables has reached 14.8% of the national consumption, of which almost half
Search WWH ::

Custom Search