Database Reference
In-Depth Information
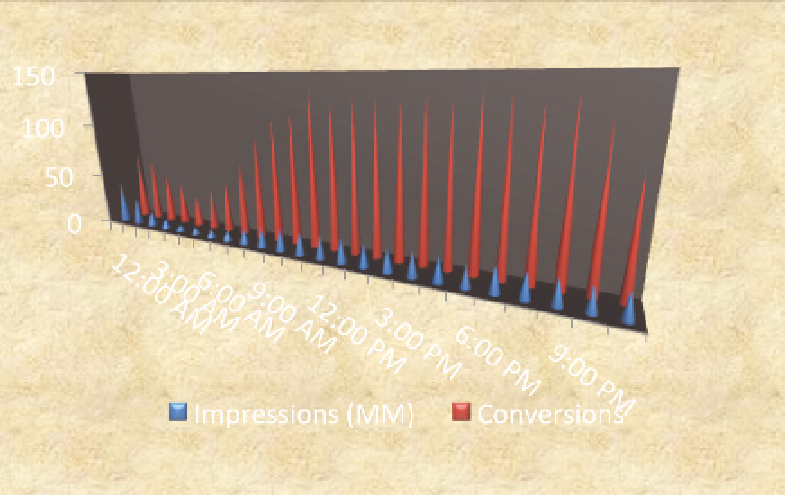
of different colored values, 3-D bar charts with illegible labels, and tables with
microfonts can make it almost impossible to recover the original data. Figure 4-15
is just one of many confusing charts available for public consumption.
Figure 4-15
A confusing call center chart
This call center chart does a great job of blocking any data understanding.
To avoid confusion, or to understand confusing data products, the following
section suggests three guiding questions to dissect data products.
DISSECTING DATA PRODuCTS
You experience data products in everyday life—labels on food, traffic maps,
and weather sites. The reports, presentations, and dashboards you see at
work are seldom so expertly designed and easy to understand. To become
a data fluent consumer, you'll need to build on your understanding of data
and charts to explore the meaning in complex data products. This section
provides a description of three key questions:
Where does the data product come from?
⬛
What can you learn from it?
⬛
What can you do with it?
⬛
Search WWH ::

Custom Search