Database Reference
In-Depth Information
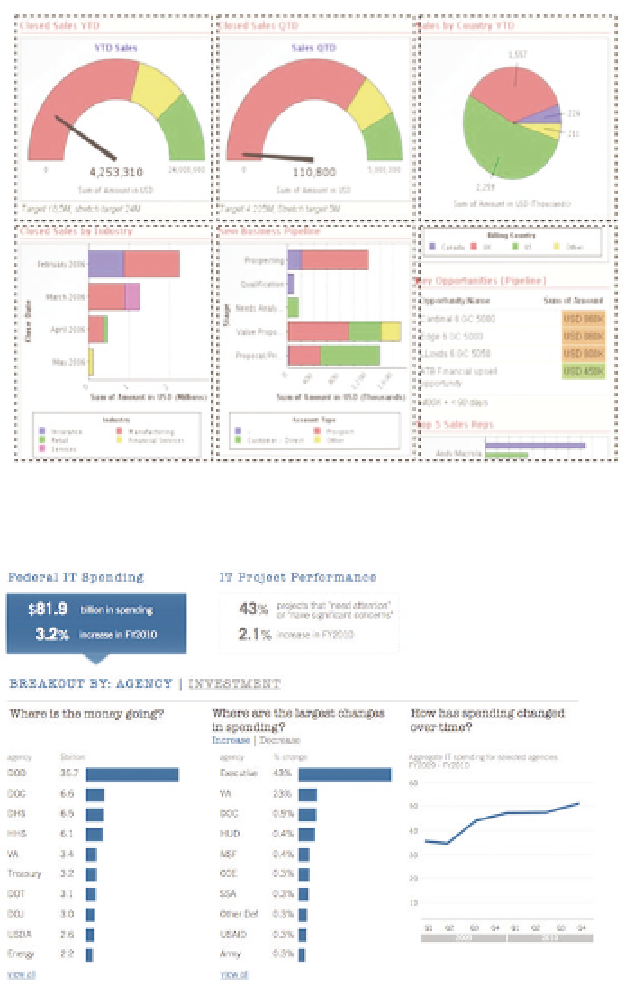
high-level metrics (e.g., federal IT spend and change in spend) and then flows
into the details about the agencies most responsible for these key metrics.
Figure 5-6:
This common dashboard layout provides little guidance for users about how to
explore the data.
Figure 5-7:
A redesigned version of the Federal IT dashboard makes it easy to see where
to start and where to go next.
Source: Juice analytics

Search WWH ::

Custom Search