Biology Reference
In-Depth Information
A
0
20
40
60
80
100
cM
B
0
20
40
60
80
100
cM
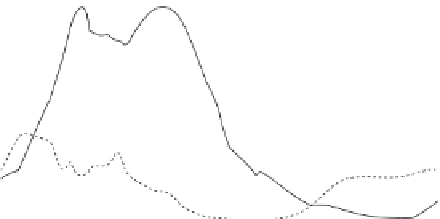
FIGURE 10.4
Interval mapping of the first two principal components of silverfox behavior
(PC1, PC2) to Fox chromosome 12 (VVU12). Interval mapping using GridQTL software, was
undertaken on (A) a combined data set including all experimental silver fox populations; and
(B) Backcross-to-tame population only (i.e. excluding backcross-to-aggressive, and F2). Solid
lines
5
PC1, dashed lines
5
PC2. The F stat (y-axis) is graphed as a function of cM distance across
VVU12 (data and map distances from: Kukekova et al. 2011). Horizontal lines (solid
5
PC1,
dashed
5
PC2)
5
thresholds for genome wide significance at P
,
0.01. Interval mapping across all
populations (A) yields support for PC1-associated loci on VVU12, located broadly between 10
and 60 cM, that exceeds the threshold for genome-wide significance; but support for PC2 does
not achieve significance. Interval mapping restricted to backcross-to-tame populations (B) yields
support for PC2-associated loci on VVU12, located broadly between 10 and 60 cM, that exceeds
the threshold for significance; but support for PC1 does not achieve significance.
analysis of the transcriptome of tame and aggressive foxes. High-throughput
genetic sequencing of all the gene transcripts expressed in a specific tissue
sample yields that sample's transcriptome, and provides quantitative infor-
mation about gene expression in different tissues. Comparative analysis of
gene expression in tame and aggressive foxes will highlight the expressed
parts of the genome that differentiate the strains. Furthermore, comparison
of gene expression profiles and loci (QTL) identified in the course of genetic


Search WWH ::

Custom Search