Biology Reference
In-Depth Information
136
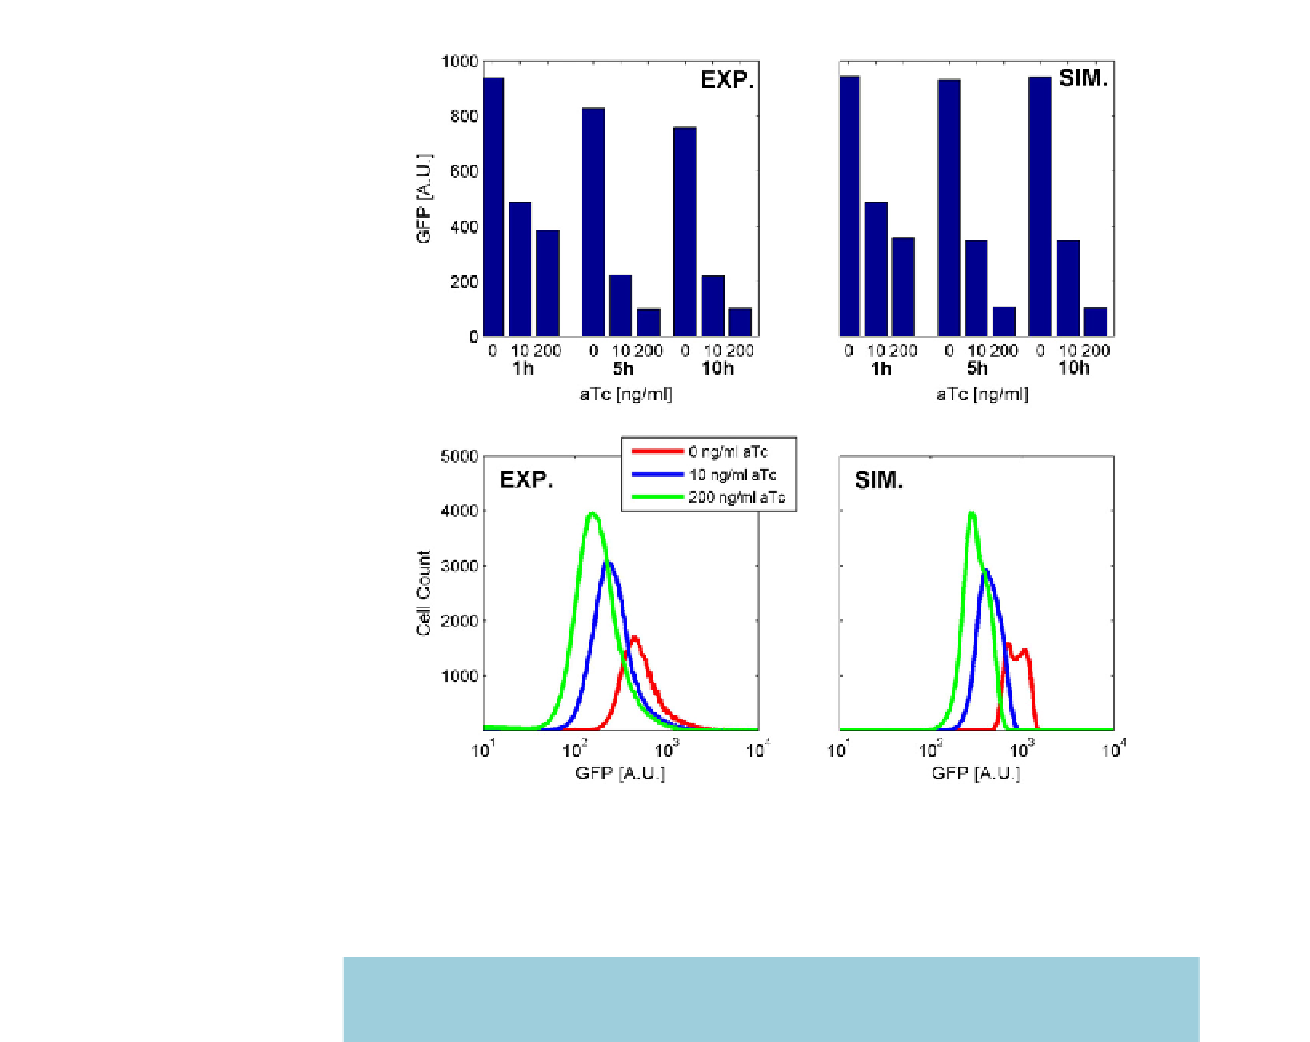
FIGURE 7.9
Behavior of the proTeOff system. Upper panel: Experimental (left) and simulation (right) results of the average cell behavior 1,
5, and 10 hours post-induction with 0, 10, and 200 ng/ml aTc. Lower panel: Experimental (left) and simulation (right) results
of the average cell behavior 1 hour post-induction with 0, 10, and 200 ng/ml aTc.
TABLE 7.1
Dissociation Constants of Biomolecular Interactions Underlying proTeOn
and proTeOff (Units: Second Order Reactions: M, Third Order Reactions:
M
2
)
15
Biomolecular Interactions
Binding Affinity
proTeOn
proTetOff
2.5 10
2
5
2.5 10
2
10
PROTET
1
tetO
2
PROTET:tetO
2.5 10
2
10
2.5 10
2
2
PROTET:aTc2
1
tetO
2
PROTET:tetO:aTc2
3.7 10
2
9
3.7 10
2
9
RNApol
1
pro
1
tetO
2
RNApol:pro:tetO
1.67 10
2
10
2.56 10
2
10
RNApol
1
pro
1
PROTET:tetO
2
RNApol:pro:tetO:PROTET
experimental work will be increasingly important as synthetic systems become larger and
increasingly nonlinear. However, accurate implementation of mathematical models will
depend upon the availability of quality kinetic data for the species or parts used. High-quality,
cross-disciplinary work between computer science, mathematics, and the biological sciences is
now needed to drive continuous progress in this emerging field of synthetic biology.